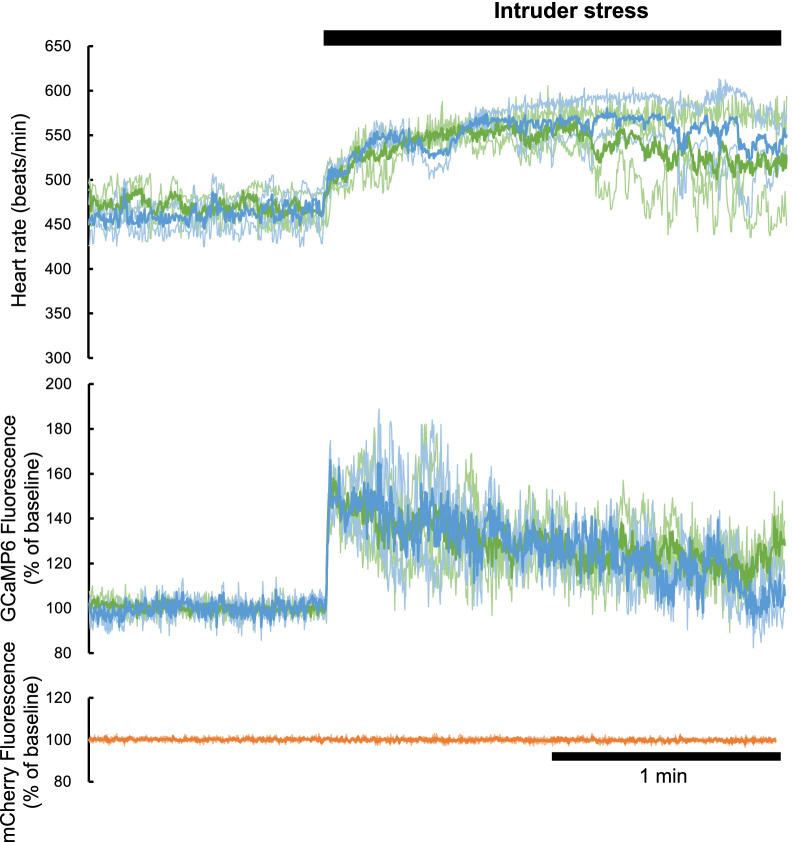
Fig. 2.
Physiological confirmation showing activation of putative orexin neurons to intruder stress. The time course of the heart rate, GCaMP6 fluorescence, and mCherry fluorescence during intruder stress are shown from the top to the bottom. We used three model 1 animals, shown in green, and two model 2 animals, shown in blue. Thin lines indicate the data from individual animals, and thick lines indicate the averaged values. Note that the averaged responses in models 1 and 2 were almost similar for both heart rate and GCaMP fluorescence. mCherry data were only obtained in three model 1 animals and showed no change on exposure to the intruder

