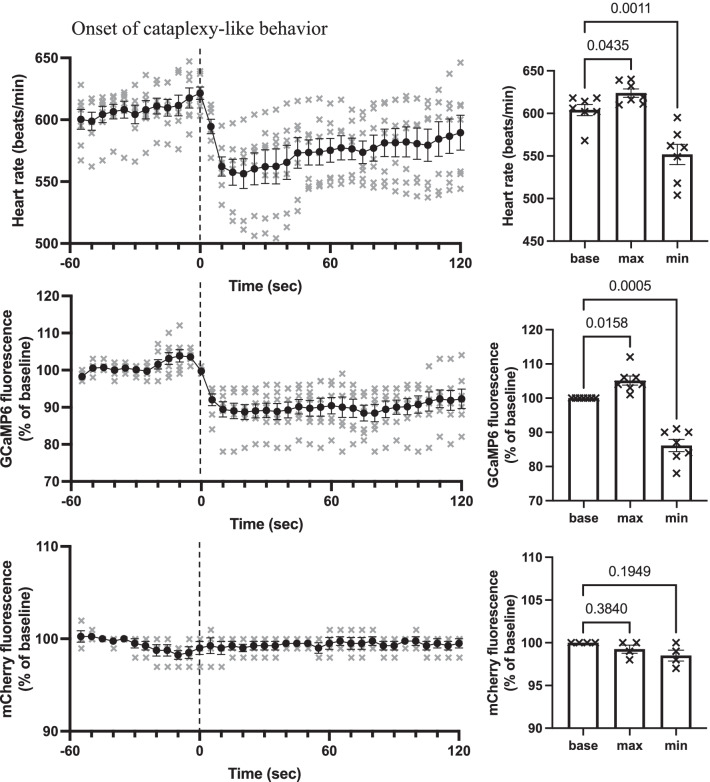
Fig. 4.
Time-related changes in the heart rate, GCaMP fluorescence, and mCherry fluorescence grouped from seven animals. Left column: Time course of the heart rate, GCaMP6 fluorescence, and mCherry fluorescence during cataplexy-like behavior are shown from the top to the bottom. The averaged value in one animal for all of the cataplexy-like episodes (see thick line in Fig. 3) was resampled in 5-s bins and was averaged for seven animals. Circles denote mean values, and vertical lines denote the standard error of the mean. The individual values are indicated by crosses. Heart rate and GCaMP fluorescence data were obtained from four model 1 animals and three model 2 animals. mCherry data were obtained from four model 1 animals. Right column: Baseline value during the 30–60 s before, maximum value during the 0–30 s before, and minimum value during the 0–90 s after the onset of cataplexy were compared. There were significant differences in heart rate values (F2,6 = 37.26, p = 0.0001) and GCaMP6 values (F2,6 = 47.75, p = 0.0001), but not in mCherry values (F2,3 = 4.765, p = 0.1055). P values in the figure were obtained using 1-way analysis of variance, followed by Sidak’s multiple comparison test

