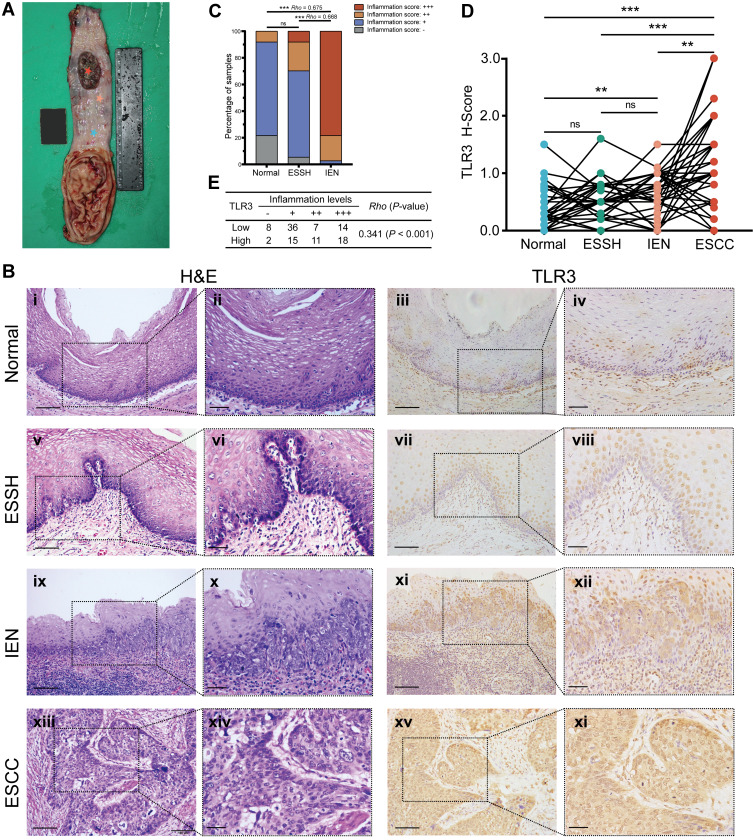
Figure 1.
Inflammation levels and TLR3 protein expression in esophageal tissues at different pathologic stages. (A) Schematic diagram of esophageal tissues sampling. The stars in various colors from top to bottom in the esophageal mucosa represent respectively: esophageal squamous cell carcinoma (ESCC, inside tumor), tumor proximal tissue of early lesions for identifying esophageal squamous simple hyperplasia (ESSH) and intraepithelial neoplasia (IEN), and distant non-malignant tissue. (B) Microscopic images of esophageal tissues at different pathologic stages with different levels of inflammation and TLR3 protein expression, i–ii, Normal: rare inflammation; v–vi, ESSH: general mild inflammation; ix–x, IEN: common moderate or severe inflammation; xiii–xiv, ESCC. IHC showing TLR3 expression from normal (iii–iv), ESSH (vii–viii), IEN (xi–xii) to ESCC (xv-xvi). Scale bars:100 μm (i, iii, v, vii, ix, xi, xiii and xv) and 40 μm (ii, iv, vi, viii, x, xii, xiv, and xi). (C) Correlation between inflammation score and histologic types. Rho indicates Spearman rank correlation coefficient. (D) The protein expression levels of TLR3 in 37 paired esophageal tissues: Normal, ESSH, IEN, and ESCC samples. P < 0.0083 (α=0.05/6) was considered statistically significant in pairwise comparison. (E) Correlation between inflammation score and TLR3 H-score (the High and Low TLR3 groups are based on the ROC curve). **P < 0.01; *** P < 0.001; “ns” indicates no significance.

