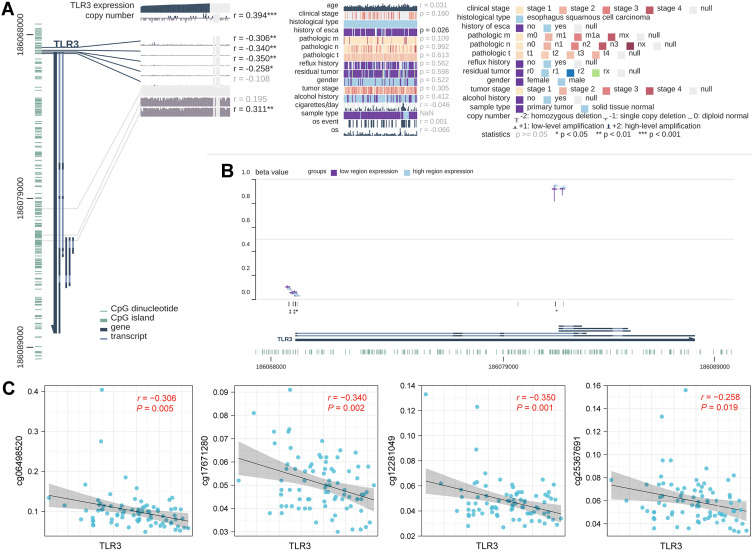
Figure 3.
Correlations between TLR3 expression and DNA levels in TCGA ESCC patients. (A) Correlation between TLR3 expression and clinical parameters, copy number, and DNA methylation. The statistics, including correlation coefficient (r) and p-value, are on the right. (B) Summary view of DNA methylation differences in which the samples had been divided into two groups based on their TLR3 expression level. The horizontal lines at each probe position represent the median percentage of methylation (β Value), while the vertical lines indicate the range between 25% and 75%. (C) Scatter diagram and correlation analysis of TLR3 expression and methylation levels of CpG sites, including cg06498520, cg17671280, cg12281049, and cg25367691. *P <0.05, **P <0.01, **P <0.001.

