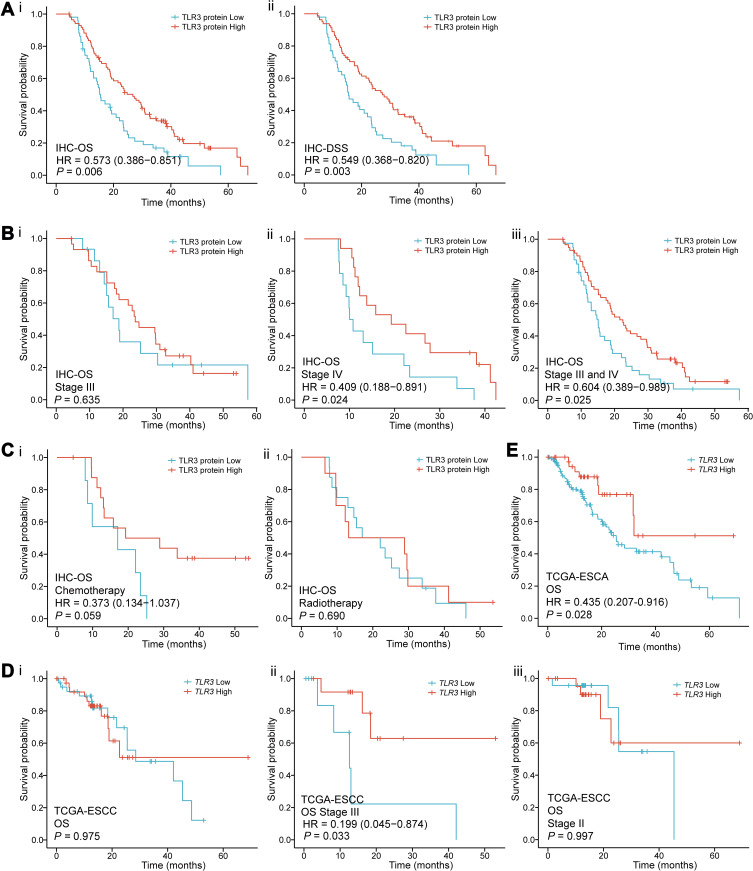
Figure 4.
Survival curves for TLR3 in IHC samples and TCGA. (A) Survival curves in IHC samples indicated that ESCC patients with low TLR3 protein expression had a shorter OS (i) and DSS (ii) than those with high-level of TLR3 (15.4 vs 26.7 months, P = 0.006; 15.4 vs 27.3 months, P = 0.003, respectively) in the IHC samples. (B) Stratified by TMN stage, i. there was no statistical significance in stage III (P = 0.635); ii, iii. the OS of stage IV or combined stage III and IV patients with high TLR3 level was significantly longer than that of patients with low TLR3 level (P = 0.024 and P = 0.025, respectively). (C) The survival curves for having received postoperative chemotherapy (i, P = 0.059) or radiotherapy (ii, P = 0.690) patients in IHC samples. (D) The survival curves of OS in the TCGA-ESCC patients. i. all the data; ii. TNM stage III (P = 0.033, HR = 0.199, 95% CI: 0.045–0.874); iii. TNM stage II. (E) ESCA patients with low TLR3 mRNA expression had a shorter OS than those with high levels of TLR3 (13.2 vs 18.3 months, P = 0.028) in the Kaplan-Meier survival curves from the TCGA.

