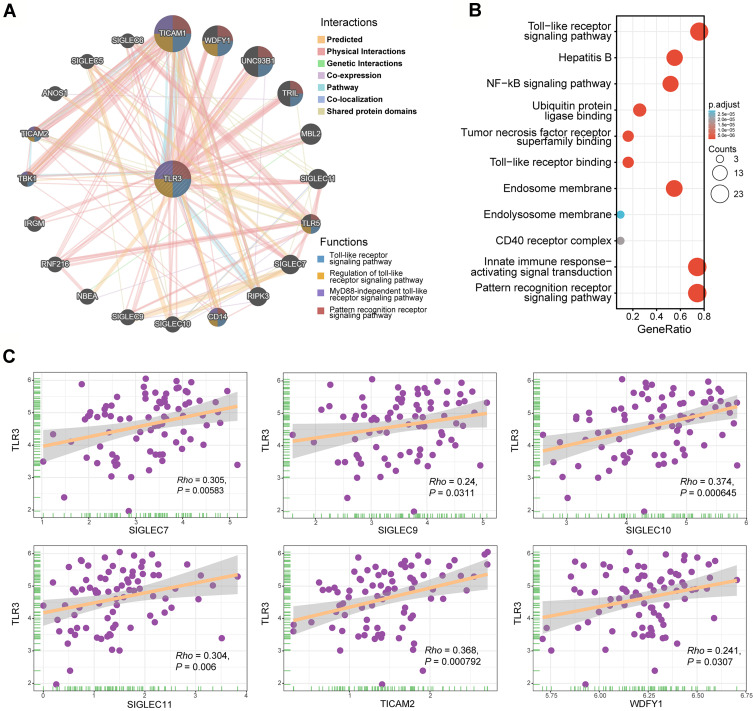
Figure 5.
Interaction network of frequently interacting genes and functional enrichment analyses. (A) Gene to gene interaction network with frequently interacting genes (GeneMANIA, accessed on Sept 8th, 2021): the node size, color of lines, and colored node circle sections represent the strength of interaction, the types of interaction between genes, and functions of the respective genes, respectively. (B) GO enrichment and KEGG pathway analyses of 21 involved genes. (C) Correlation analyses between the expression of TLR3 and co-expressed genes in ESCC. SIGLEC7, sialic-acid binding Ig-like lectin 7; SIGLEC9, sialic-acid binding Ig-like lectin 9; SIGLEC10, sialic-acid binding Ig-like lectin 10; SIGLEC11, sialic-acid binding Ig-like lectin 11; TICAM2, toll-like receptor adaptor molecule 2; WDFY1, WD repeat and FYVE domain containing 1.

