Figure 6.
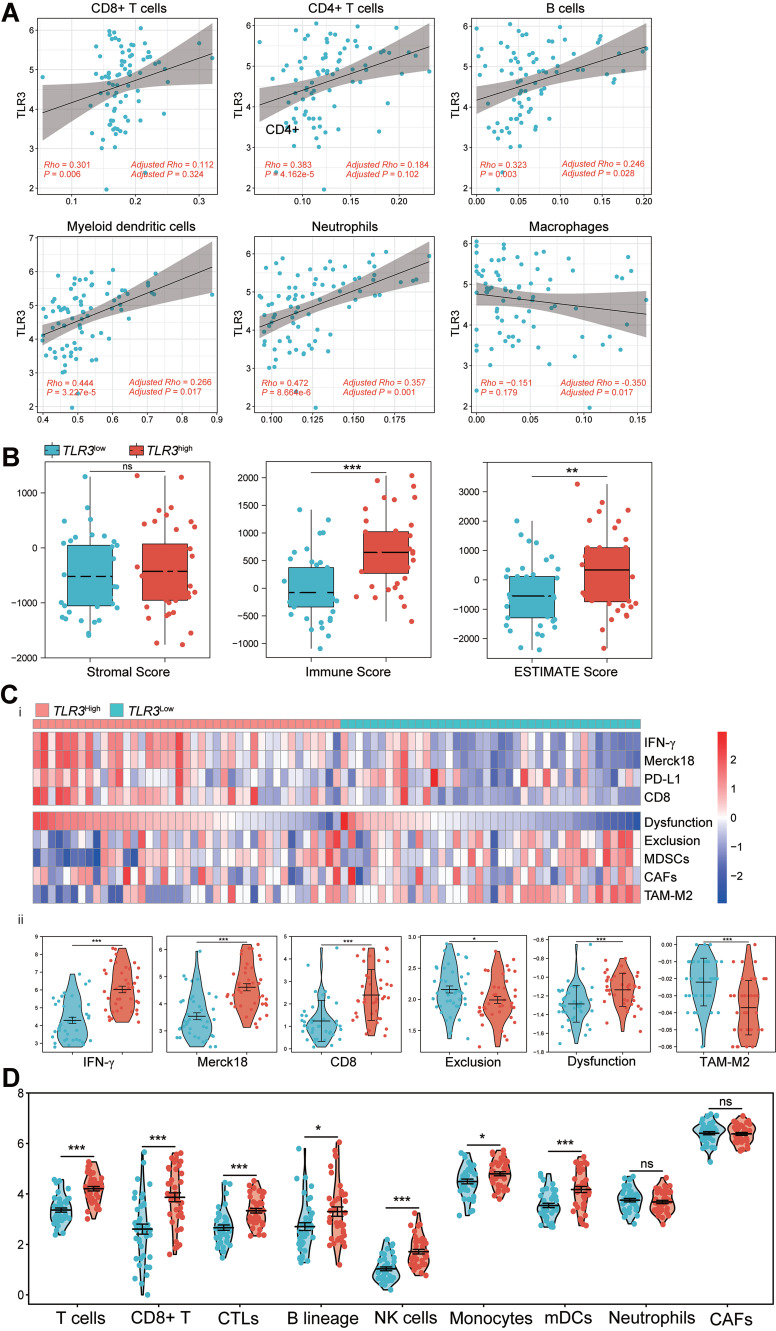
Correlations between TLR3 expression and immune infiltration level predict immunotherapeutic response. (A) Scatter diagram and correlation analysis of TLR3 expression with six types of immune infiltration levels, including CD8+ T cells, CD4+ T cells, B cells, neutrophils, macrophages, and dendritic cells in TCGA ESCC. Results are also shown after being adjusted for tumor purity. (B) Boxplot showing stromal, immune, and ESTIMATE scores within TLR3low and TLR3high groups. (C) i. Heatmap of biomarkers for prediction of immunotherapeutic response from the TIDE dataset, including IFN-γ, Merck18 (T cell-inflamed signature), PD-L1, CD8, dysfunction, exclusion, MDSCs, CAFs, and TAM-M2 (M2 subtype). ii. Violin plot showing IFN-γ, Merck18, CD8, exclusion, dysfunction, and TAM-M2 scores within TLR3low and TLR3high groups. (D) Violin plot showing T cells, CD8+ T cells, CTLs, B-cell lineage, NK cells, monocytes, myeloid dendritic cells (mDCs), neutrophils, and CAFs between TLR3low and TLR3high groups. *P < 0.05, **P < 0.01, ***P < 0.001; “ns” indicates no significance.

