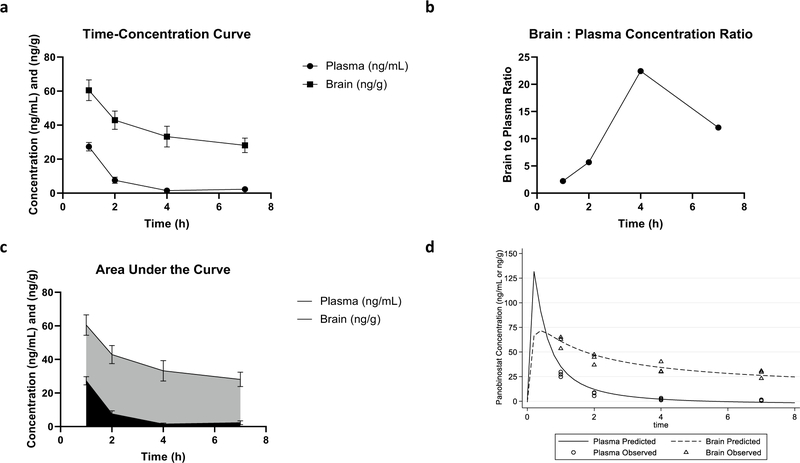
Fig. 2.
Pharmacokinetic profile of panobinostat. Pharmacokinetic profile of panobinostat in brain and plasma. a Time–concentration curve of panobinostat concentrations in brain and plasma. Mean concentrations (ng/mL) of panobinostat in the plasma (circle) were 27.3 ± 2.5 at 1 h, 7.56 ± 1.8 at 2 h, 1.48 ± 0.56 at 4 h, and 2.33 ± 1.18 at 7h. Mean concentrations (ng/g) of panobinostat in the brain (square) were 60.5 ± 6.1 at 1 h, 42.9 ± 5.4 at 2 h, 33.2 ± 6.1 at 4 h, and 28.1 ± 4.3 at 7 h. b Brain:Plasma concentration ratios of panobinostat over time. Ratios of brain panobinostat concentration to plasma panobinostat concentration were 2.22 at 1 h, 5.67 at 2 h, 22.43 at 4 h, and 12.06 at 7 h. c Plasma and brain area under the curve (AUC) profile for panobinostat in plasma and brain. The AUC from hour 1 to hour 7 of plasma (black) was 95.0 h.ng/mL and brain (gray) was 250 h.ng/g. d Observed and model predicted (median) plasma and brain concentrations of panobinostat in mice. The estimated Cmax in plasma and brain with a 15 mg/kg IV dose is 131.7 ng/mL and 72.4 ng/g, respectively. Figures created with GraphPad Prism. Abbreviations: Cmax = maximum concentration, IV intravenous

