Figure 1.
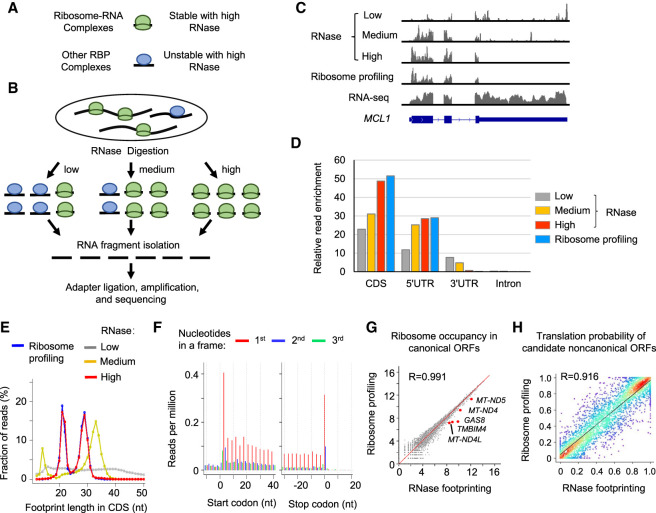
Different doses of RNase treatment effectively distinguish RNA footprints bound by 80S ribosomes versus other RBPs in coding regions. (A) Schematic illustration of RNA–protein complexes. (B) Experimental steps of isolating RNase footprints for sequencing with three different doses of RNase: low (0.05 U/μg), medium (0.5 U/μg), and high (50 U/μg). (C) Example read distribution across the gene MCL1 with three different doses of RNase. Both RNA-seq and ribosome profiling data are shown for comparison. (D) Relative enrichment of reads in different regions of mRNAs (i.e., coding region [CDS], 5′ UTR, 3′ UTR, and intron). We calculated the fraction of reads in each region and then normalized the value by the relative total length of the region. (E) The distribution of the lengths of RNA fragments in coding regions of mRNAs. (F) RNase footprinting (high-dose) read distribution around the start and stop codons of mRNAs. For footprints showing strong 3-nt periodicity, we adjusted their 5′-end genomic location to the ribosomal A-sites, and plotted the read per million (RPM) values (for details, see Methods). (G) Correlation of read counts in coding regions measured by RNase footprinting (high-dose) and ribosome profiling. The x-axis and y-axis represent log2(read count + 1). We highlighted a few genes showing more than 1.2-fold greater expression levels by RNase footprinting compared with ribosome profiling. (H) The correlation between RibORF-predicted translation probabilities of candidate ORFs using RNase footprinting (high-dose) versus ribosome profiling data in HEK293T cells. We randomly picked 2000 candidate ORFs for the scatter plot colored by density (red color indicates more data points). The Pearson correlation coefficient value is indicated in the plot.

