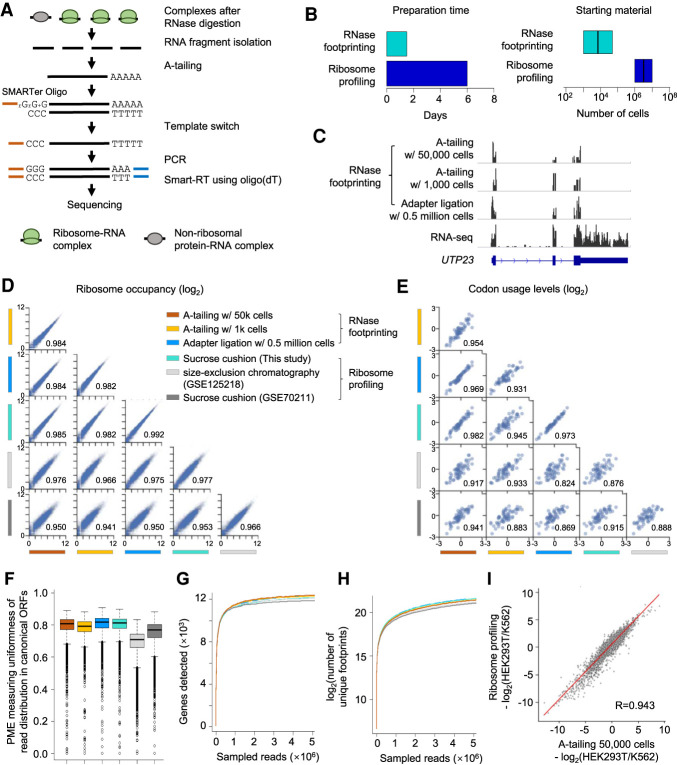
Figure 2.
Low-input RNase footprinting quantifies ribosome occupancies using 1000 and 50,000 HEK293T cells. (A) The experimental procedure of low-input RNase footprinting. (B) Comparison of preparation time and starting material between RNase footprinting and conventional ribosome profiling. (C) Read distribution representing different RNase footprinting methods across the example gene UTP23. RNA-seq data are shown as the control. (D) Correlation of ribosome occupancies inferred by our RNase footprinting and conventional ribosome profiling data sets. The x-axis and y-axis represent log2(RPM + 1) in coding regions. The Pearson correlation coefficient values are indicated in the plot. (E) Correlation of codon usage levels (log2) at the ribosomal P-sites inferred by our RNase footprinting and conventional ribosome profiling data sets. The Pearson correlation coefficient values are indicated in the plot. (F) The distribution of the percentage of maximum entropy (PME) values, measuring the uniformness of read coverage across codons of canonical ORFs. We included genes with more than 10 reads in the analysis. A PME value closer to one indicates higher uniformness of read distribution. (G,H) We downsampled the sequencing reads and then calculated the number of genes (G) and unique footprints (H) detected by different data sets with a fixed number of reads. (I) The differential ribosome occupancy between HEK293T and K562, comparing our RNase footprinting data to ribosome profiling data. The Pearson correlation coefficient value is indicated in the plot.

