Figure 3.
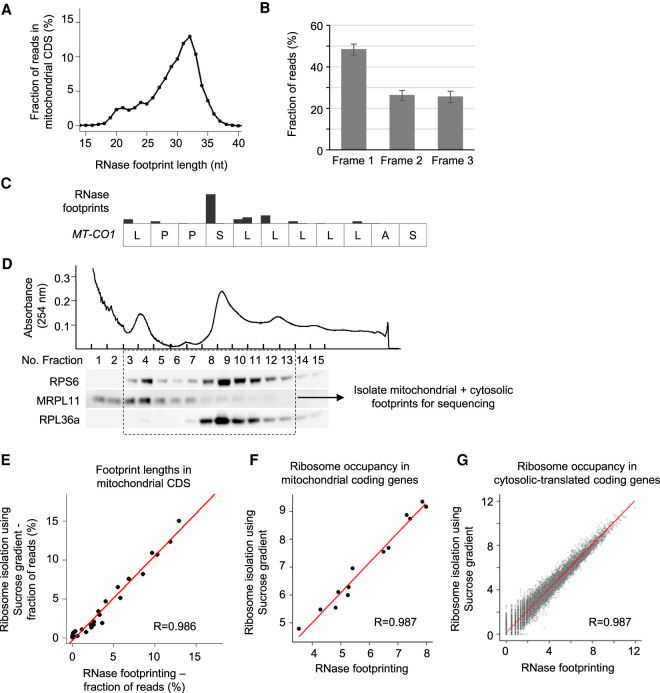
RNase footprinting examines mitochondrial translation. (A) The distribution of footprint lengths across mitochondrial protein-coding regions. (B) The fractions of reads in the three codon frames. The 32-nt-long footprints (the peak size) in mitochondrial coding regions were used for the calculation. The SD represents the variation across 13 mitochondria-encoded protein-coding genes. (C) An example transcript region of MT-CO1, showing the 3-nt periodicity of read distribution. (D) We used the sucrose gradient to isolate 55S mitoribosome and 80S ribosome complexes and then extracted associated footprints for sequencing. We performed western blots for ribosomal proteins to show the fractions containing 55S mitoribosomes and 80S ribosomes. (E) The correlation of footprint length distribution in mitochondrial coding regions calculated using our RNase footprinting and sucrose gradient-based ribosome profiling. (F,G) The correlation of ribosome occupancies in mitochondrial-encoded (F) and nuclear-encoded (G) coding genes calculated using the two methods. The RNase footprinting data using 50,000 HEK293T cells were used for the analyses.

