Figure 4.
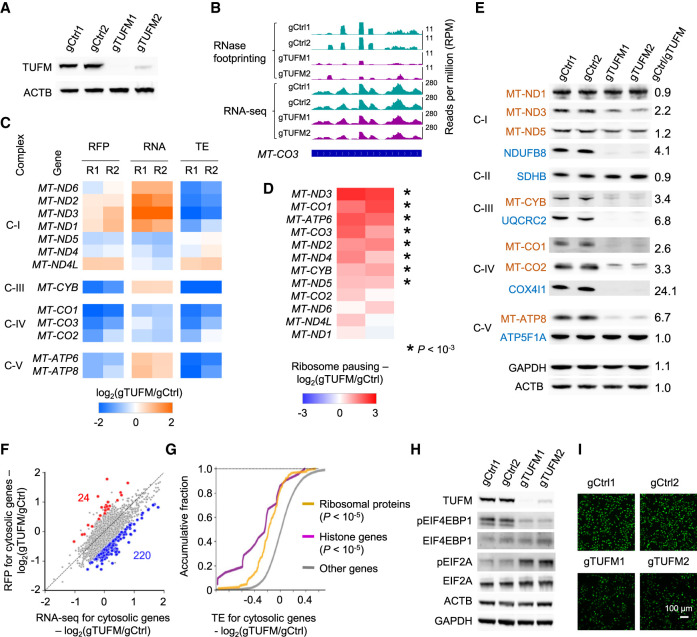
Regulation of mitochondrial and cytosolic RNA translation after TUFM knockout. (A) The western blots showing TUFM knockout. The expression of actin (ACTB) was used as the control. (B) RNase footprinting and RNA-seq read distribution across the MT-CO3 gene in TUFM knockout and control cells. (C) The regulation of ribosome occupancy (ribosome footprints [RFP]), RNA expression (RNA), and translation efficiency (TE) of 13 mitochondria-encoded genes after TUFM knockout. (R1/R2) Replicates 1 and 2. Complexes of the mitochondrial electron transport chain are indicated at left (I, III, IV, and V). (D) The regulation of ribosome pausing of mitochondria-encoded genes after TUFM knockout. The ribosome pausing level was calculated as the ratio of RNase footprinting read density in the first 20% of a transcript versus the remaining. Asterisks indicate significantly increased ribosome pausing after TUFM knockout with a Fisher's exact test (P < 10−3). (E) Western blots showing the expression of mitochondria-encoded (red) and nuclear-encoded (blue) mitochondrial proteins after TUFM knockout. The expression levels of GAPDH and ACTB were used as the control. The ratios of protein expression between the control and TUFM knockout are shown. Complexes I–V of the mitochondrial electron transport chain are indicated at left. (F) Change in mRNA and RFP levels after TUFM knockout. The genes showing differential translation efficiency are highlighted. (Blue) Down-regulated; (red) up-regulated. (G) The cumulative distribution function plot showing the changes in TE of indicated gene sets. The P-values comparing “ribosome proteins” and “histone genes” versus other genes are shown. (H) Western blots showing the expression of translation factors after TUFM knockout. (I) Nascent proteins containing the methionine analog (AHA) were visualized by fluorescence microscopy. An identical setting was used to acquire images, and the percentage of fluorescent cells was 100%. The down-regulation of AHA fluorescence in TUFM knockout cells indicates the inhibition of new protein synthesis.

