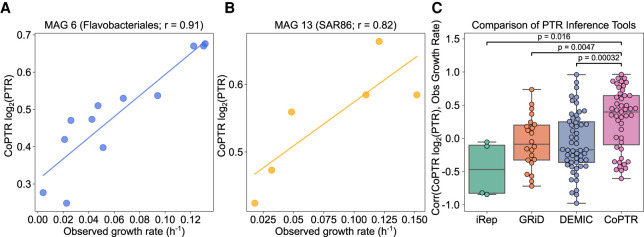
Figure 4.
CoPTR values strongly correlate with observed growth rates. (A,B) log2(PTR) estimates (y-axis) versus observed growth rates (x-axis; Methods), for two well predicted MAGs: MAG 6, classified as Flavobacteriales (A), and MAG 13, classified as SAR86 (B). Lines are linear regressions. (C) Comparison of per-MAG Pearson r (y-axis) for all MAGs with more than three pairs of measured growth rates and calculated PTRs. CoPTR values are compared to GRiD, DEMIC, and iRep. Significance was computed using a two-sided Mann–Whitney U test.

