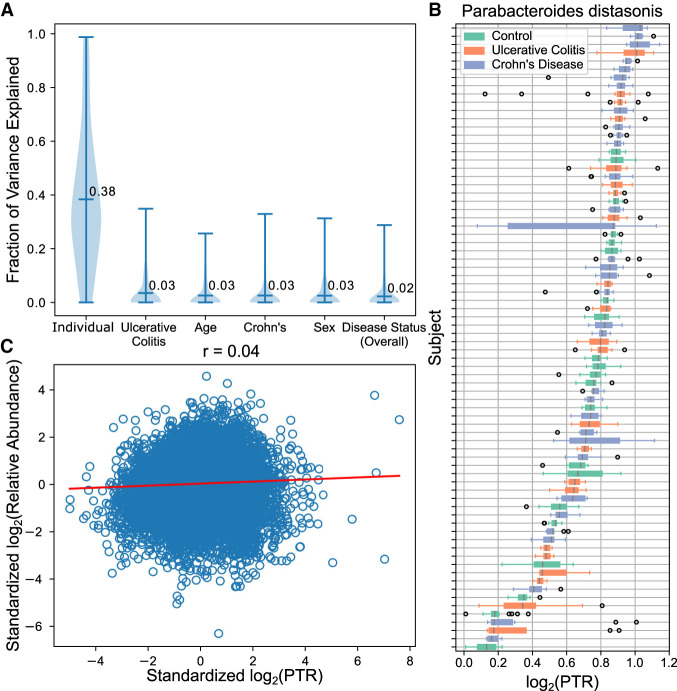
Figure 5.
PTRs are highly personalized and uncorrelated with relative abundances. (A) Fraction of variance of log2(PTR) explained per species by variation between individuals, disease-statuses, age, and sex. Inter-individual variation accounts for most variation among log2(PTR)s of the variables explored. (B) Boxplots of the log2(PTR) (x-axis) of Parabacteroides distasonis across individuals (y-axis). P. distasonis had the smallest P-value when testing for individual differences using the Kruskal–Wallis test on controls. PTRs appear stable within individuals. (C) Correlation between standardized log2(PTR) and log2(relative abundance) on species matched to relative abundances estimated with MetaPhlAn2.

