Figure 1.
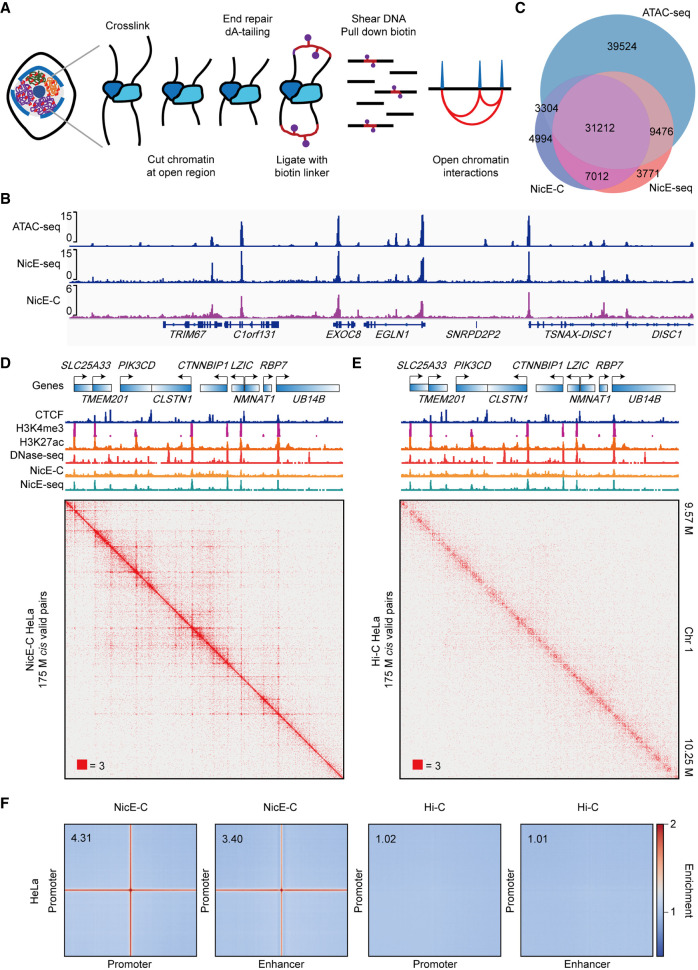
NicE-C discovers open chromatin–associated chromatin interactions. (A) Schematic of the NicE-C method. (B) A snapshot of chromatin accessibility detected by NicE-C, NicE-seq, and published ATAC-seq data for HeLa cells. (C) Venn diagram of open chromatin peaks identified by NicE-C, NicE-seq, and published ATAC-seq data. (D,E) HeLa NicE-C (D) and Hi-C (E) chromatin contact maps of an example region on Chromosome 1 at 1-kb resolution. Snapshots of 1D chromatin tracks (ChIP-seq of CTCF, H3K4me3 and H3K27ac, DNase-seq [for references, see Methods], open chromatin signal of NicE-C and NicE-seq) in this region are also shown. Numbers below the interaction maps correspond to the maximum signal in the matrix. (F) Genome-wide averaged pile-up matrices (plotted at 1-kb resolution, windows = 200 kb) showing promoter–promoter/promoter–enhancer interactions (P-P/E-P loops) and stripes detected by NicE-C (HeLa) and Hi-C (HeLa).

