Figure 3.
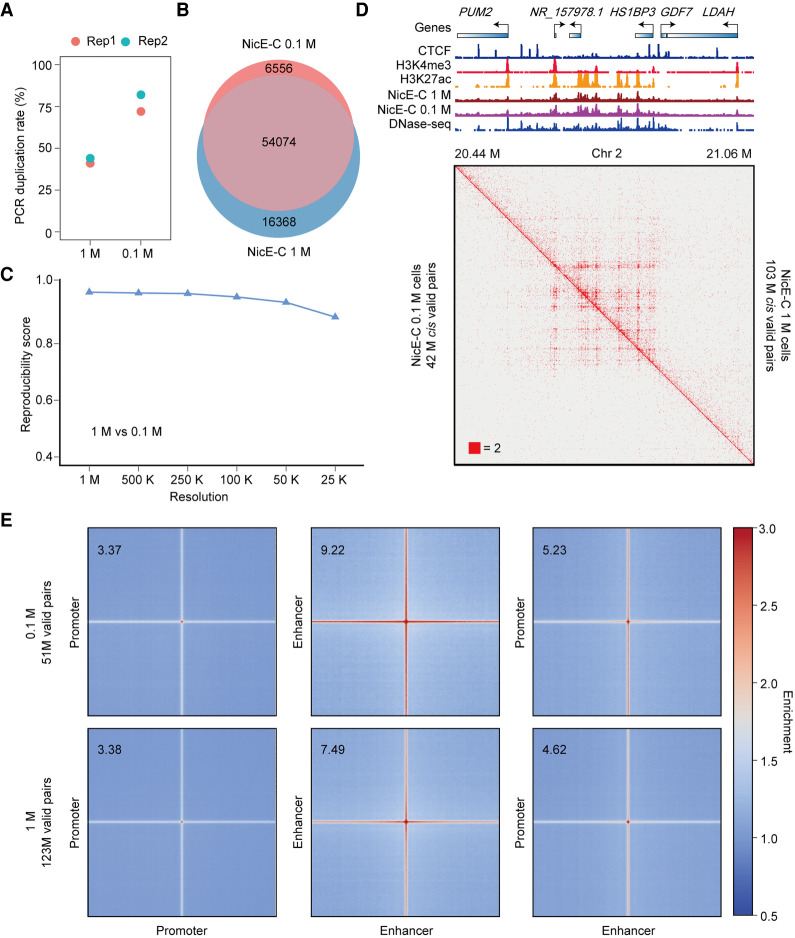
Comparison of NicE-C with 1 M and 0.1 M HeLa S3 cells. (A) PCR duplication rates of NicE-C (approximately 420 M reads) with 1 M and 0.1 M input cells. (B) Venn diagram of open chromatin peaks identified by NicE-C with 1 M and 0.1 M input cells. (C) Reproducibility analysis of 1 M cells and 0.1 M cells NicE-C data. Reproducibility scores were calculated by HiC-Rep at different resolutions. (D) NicE-C chromatin contact maps of an example region on Chromosome 2 at 1-kb resolution; the top right of the heatmap showed the NicE-C data with 1 M input cells, and the bottom left of the heatmap showed the NicE-C with 0.1 M input cells. Snapshots of 1D chromatin tracks (ChIP-seq of CTCF, H3K4me3, and H3K27ac, and open chromatin signals of NicE-C and DNase-seq) in this region are also shown. Numbers below the interaction maps correspond to maximum signal in the matrix. (E) Genome-wide averaged pile-up matrices of P-P, E-E, and E-P loops and stripes were plotted at 1-kb resolution (windows = 200 kb). The top plots showed NicE-C data with 0.1 M input cells, and the bottom plots showed NicE-C data with 1 M input cells.

