Figure 4.
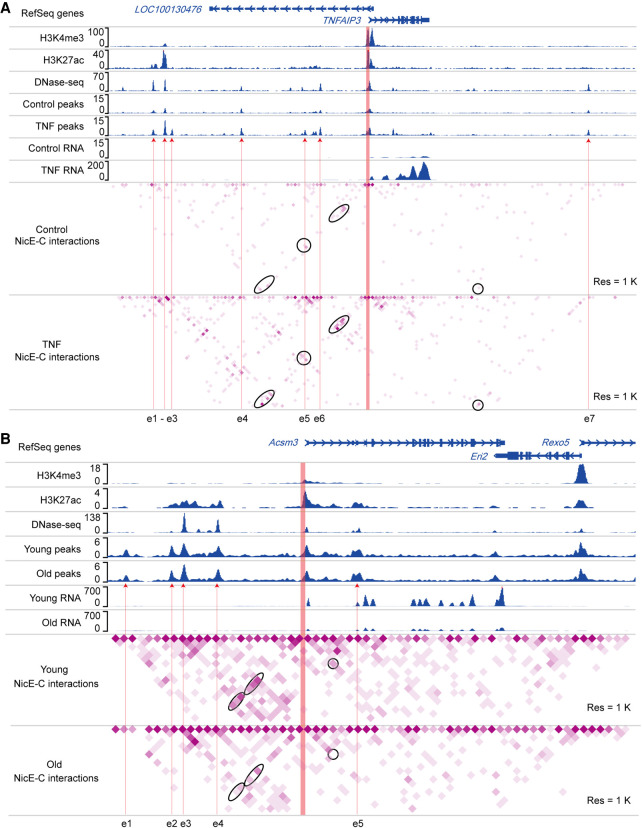
Dynamic enhancer–promoter interactions detected by NicE-C. (A) An example of TNF-stimulation-induced changes in E-P loops around the TNFAIP3 locus, detected by NicE-C. Snapshots of 1D chromatin tracks (ChIP-seq of H3K4me3 and H3K27ac, and DNase-seq [for references, see Methods]; open chromatin signals of NicE-C, and RNA-seq) in the example region are also shown. Red arrows pointing to e1 to e6 show the putative enhancers based on ChIP-seq, DNase-seq, and our NicE-C peaks. The region in orange represents the gene promoter. Ovals indicate examples of increased interactions associated with indicated gene promoter in TNF-treated cells compared to control cells. (B) An example of E-P loops in old mouse kidney compared to those in young mouse kidney around the Acsm3 locus (down-regulated gene in old mouse kidney), detected by NicE-C. Snapshots of 1D chromatin tracks (ChIP-seq of H3K4me3 and H3K27ac, DNase-seq, and open chromatin signals of NicE-C and RNA-seq) in this region are also shown. Red arrows pointing to e1 to e4 show the putative enhancers based on ChIP-seq, DNase-seq, and our NicE-C peaks. The region in orange represents the gene promoter. Ovals indicate examples of decreased interactions associated with indicated gene promoter in old kidney compared to young kidney.

