Figure 1.
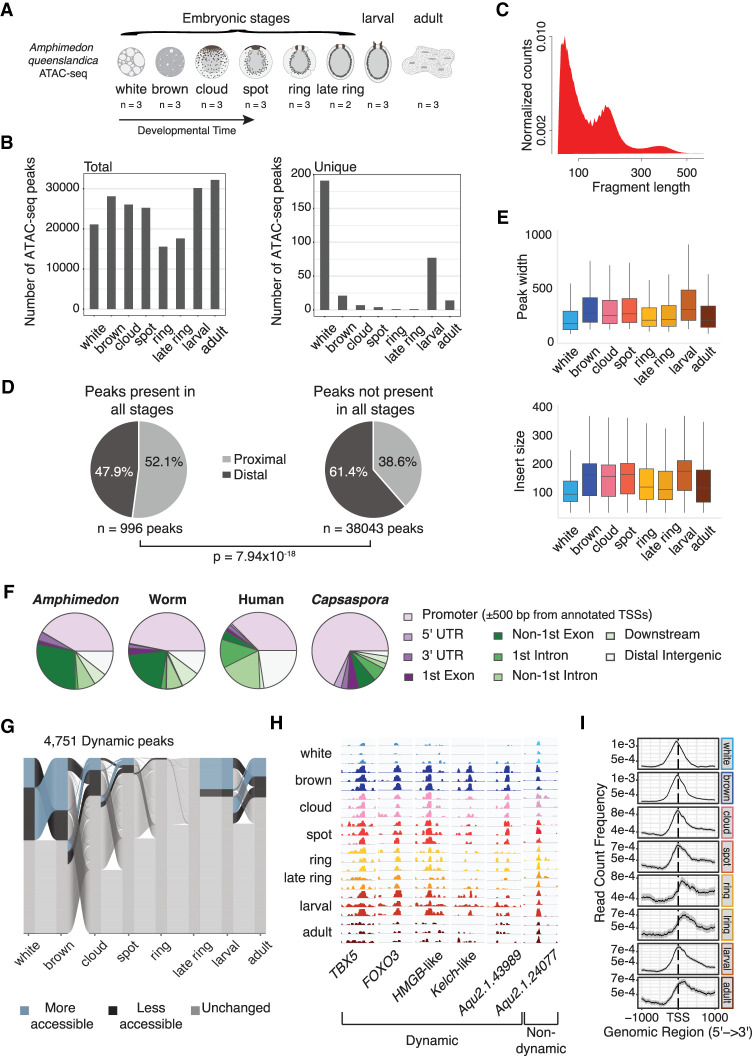
Overview of Amphimedon cis-regulatory regions. (A) Amphimedon queenslandica developmental stages. The number of ATAC-seq libraries for every developmental stage is shown. (B) Total and unique number of ATAC-seq peaks by developmental stage. Numbers for each stage calculated using the arithmetic mean across replicates. A peak must have at least a normalized count above 10 in at least one stage. Summary plot across stages required peaks with a mean count per million above zero across all replicates for each stage. (C) Density plot of ATAC-seq fragment length (base pair). (D) Pie charts show the number of proximal (within 500 bp of the TSS) and distal peaks for (1) constitutively open peaks and (2) those not accessible in all developmental stages. χ2 test was used to compute P-value. Accessible peaks across all stages: over zero normalized counts across all libraries. Peaks with varying accessibility in all stages: normalized count over one in three or more libraries. (E) Boxplot of ATAC-seq peak width and insert size. Numbers for each stage calculated using the arithmetic mean across replicates. (F) Distribution of Amphimedon, C. elegans, human, and Capsaspora ATAC-seq peaks across genomic features (Buenrostro et al. 2013; Sebé-Pedrós et al. 2016; Daugherty et al. 2017). Promoter region is defined as a region within 500 bp of the TSS for all species. Downstream is defined as ≤300 bp of the end of a gene. (G) Alluvial plot shows peak dynamics across life stages for peaks that change between at least one life stage (n = 4751) (n = 808, 1422, 334, 202, 3, 0, 851, and 509 more-accessible peaks for white, brown, cloud, spot, ring, late ring, larval, and adult, respectively; n = 1422, 808, 693, 213, 48, 0, 202, and 563 less-accessible peaks for the same stages). Differential accessibility determined by beta-binomial model (Methods). (H) Genome browser view of read coverage at selected dynamically accessible regions (TBX5: Aqu2.1.27488; FOXO3: Aqu2.1.27411; HMGB-like: Aqu2.1.41331; Kelch-like: Aqu2.1.41157; Aqu2.1.43989) and a selected consistently accessible peak (Aqu2.1.24077) across all life stages. (I) Chromatin accessibility read density around the TSS (within 1 kb) by life stage. Peaks were used only if at least 50% of bases overlapped across biological replicates.

