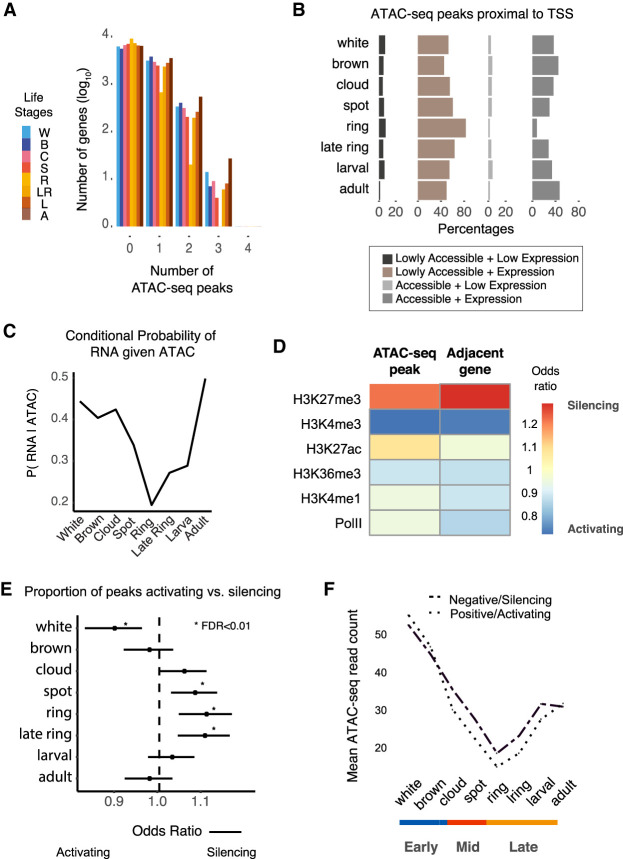
Figure 2.
Interplay between transcription and proximal cis-regulatory elements. (A) Number of cis-regulatory peaks near Amphimedon genes (flanking 1 kb of the TSS). Number of genes was log10-transformed. (B) Percentage of chromatin-accessible/inaccessible peaks near expressed/unexpressed genes for each life stage (flanking 1 kb of the TSS) (expressed genes were defined as those with one or more median cpm in stage; accessible peaks were those with one or more median normalized counts in every stage). (C) Conditional probability of gene expression given proximal ATAC-seq accessibility. (D) Heatmap denotes the ratio between silencer and active sets of peaks and proximal genes overlapping adult Amphimedon histone marks and PolII binding sites. Peak and gene are considered active if there is a positive association between chromatin accessibility and gene expression across time. Silencers are defined as those negatively associated between ATAC-seq peak and gene. (E) Forest plot shows the proportion of peaks that are active versus repressive at each life stage. Fisher's exact tests are used to assess the significance of change relative to the total number of active and repressive peaks identified. Bars denote 95% confidence intervals. (F) Change in average chromatin accessibility read counts for active and silencer peaks.

