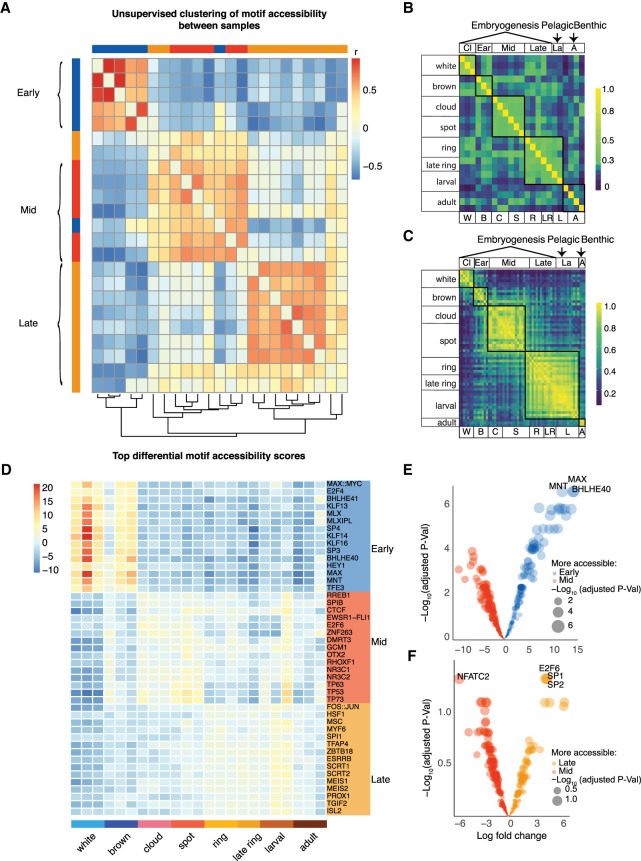
Figure 3.
Motif analyses define three major Amphimedon developmental transitions. (A) Heatmap of Pearson correlation for each library based on TF motif deviation scores. Hierarchical clustering of rows and columns was performed (Methods). (B) Hierarchical clustered heatmap of Pearson correlation of the most variable 2000 peaks based on log10-transformed ATAC-seq read counts across life stages. (C) Hierarchical clustered heatmap of the most variable 1000 genes based on expression (counts per million) across life stage. (D) Heatmap of the top differentially enriched motifs (right) based on motif accessibility, where heatmap values represent motif deviation z-score (Methods). (E) Volcano plot of differentially enriched motifs between the early and mid stages. (F) Volcano plot of differentially enriched motifs between the mid and late stages. Each colored dot represents a motif, and the size of the dot is relative to the −log10(q-value). The x-axis is the log fold change. (Early) White and brown; (Mid) cloud, spot; and (Late) ring, late ring, and larval.

