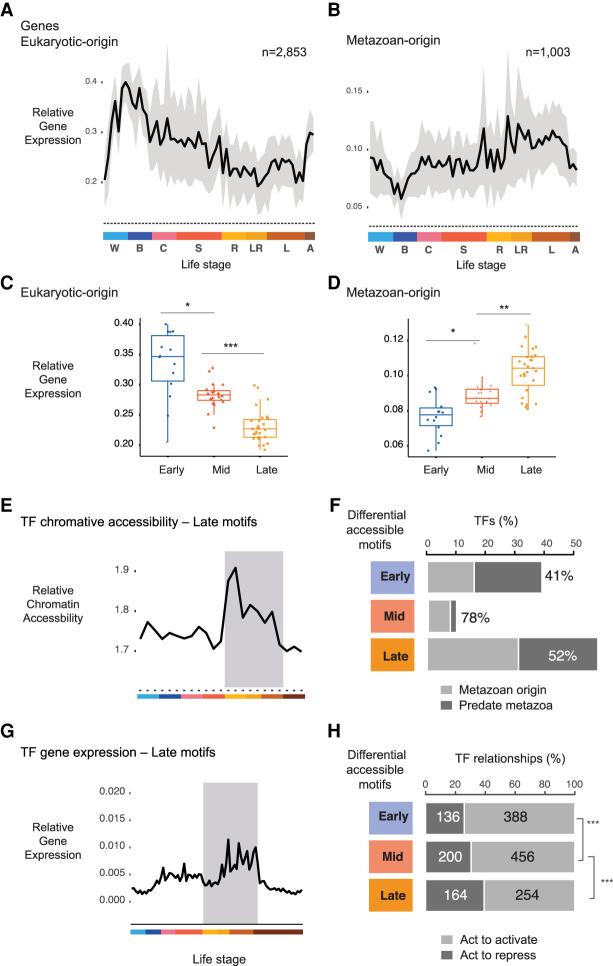
Figure 4.
Metazoan TF motifs are enriched in late development. (A) Relative expression values for sponge genes that can be traced to a eukaryotic ancestor. Gray area denotes 95% CI as determined by bootstrapping. Color denotes life stages. (B) Relative expression values for Amphimedon genes traced to the metazoan stem. Relative gene expression of transcription factors of eukaryotic origin (C) and metazoan origin (D) with binding motifs enriched in early, mid, and late Amphimedon development. (*) P < 0.01, (**) P < 0.001, and (***) P < 0.0001 (Mann–Whitney U test). (E) Relative chromatin accessibility values at TFs whose binding motifs are enriched in late Amphimedon development. Color denotes life stages as in A and B. (F) Bar plots show the number of TFs whose motifs are differentially enriched for each stage, grouped to whether the TF originated in metazoan stem versus those that predate metazoan (based on the TreeFam Amphimedon vs. human comparison). Percentage denotes TFs from the metazoan stem. (G) Relative gene expression of transcription factors with binding motifs enriched in late Amphimedon development. Color denotes life stages as in A and B. (H) Bar plots depict the number of activating versus repressive genes based on human database TRRUST (Han et al. 2018). Genes for each stage are TFs associated to stage through differential motif analyses. Numbers denote the number of unique interactions found for that gene in the activatory or repressive category. (***) P-value significance from Fisher's exact tests: early versus late, P = 2 × 10⁻⁵; mid versus late, P = 4 × 10⁻³.

