Figure 5.
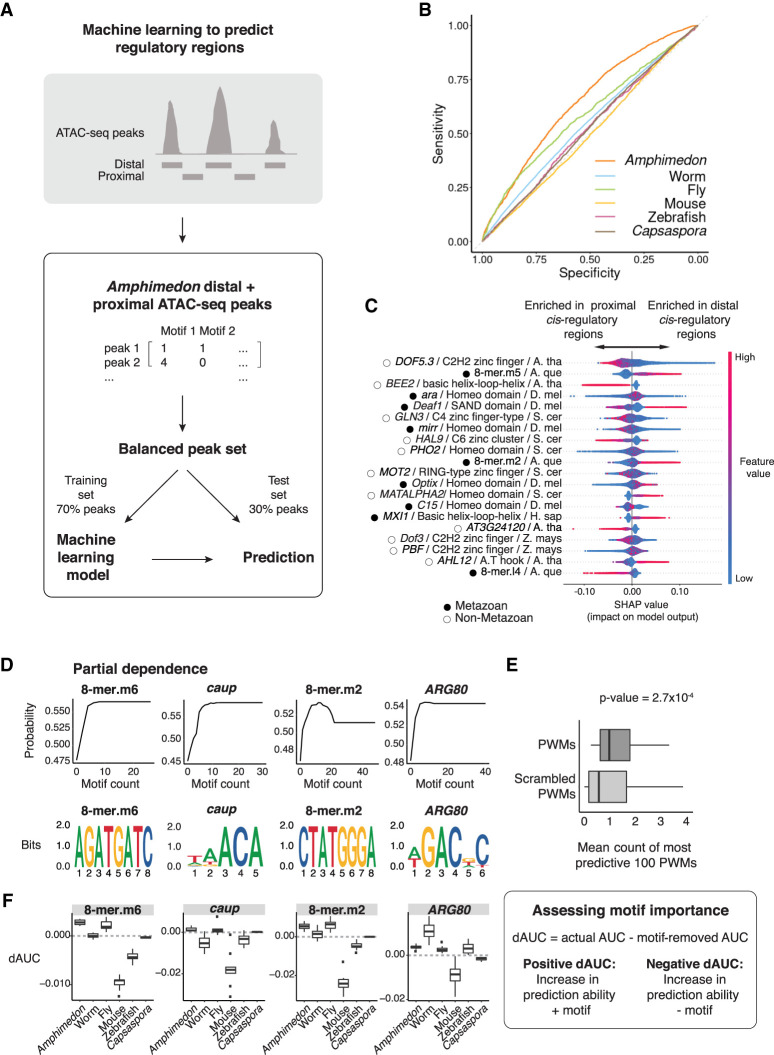
A machine learning model trained on Amphimedon motifs distinguishes between proximal versus distal cis-regulatory elements. (A) An extreme gradient boosting (XGB) machine was used on a balanced data set of Amphimedon distal and proximal cis-regulatory regions. Seventy percent of peaks was used to train an XGB model. Motif counts for each peak were used to predict distal versus proximal cis-regulatory regions in the Amphimedon test sets (30% of peaks) and other species data sets. Distal was defined as >1 kb upstream of the TSS. (B) Receiver operating characteristic (ROC) curve of distal versus proximal cis-regulatory regions prediction in Amphimedon. (C) Relative importance score (SHAP) of most predictive known motifs and 8-mers for Amphimedon distal versus proximal cis-regulatory regions. Motifs are ordered according to their importance. Every dot in the model represents a peak used for the training of the XGB model. The SHAP values (x-axis) show the impact on the prediction. Color reflects the motif count in the peak. The name, class, and species of motifs are indicated: (S. cer) S. cerevisiae, (A. tha) A. thaliana, (D. mel) D. melanogaster, (A. que) A. queenslandica, (Z. mays) Z. mays, (H. sap) H. sapiens. Metazoan and nonmetazoan TFs are indicated with black-filled and black-outlined circles, respectively. (D, top row) Partial dependence of top four most predictive PWMs of distal cis-regulatory regions (compared with genomic background), showing the relationship between the number of instances of the motifs and the probability of a region being an actual ATAC-seq peak. (Bottom row) Sequence logos of the motifs shown in D, top row. (E) Boxplots of the mean number of instances of the top 100 most predictive actual PWMs (dark gray; compared with genomic background) and permuted PWMs (light gray), Mann–Whitney U-test P-value shown (estimate = 0.41). Outliers removed from the plot and defined as values smaller than 1Q − 1.5 × IQR or bigger than 3Q + 1.5 × IQR, where “1Q” is the 1st quartile, “3Q” represents the 3rd quartile, and IQR (interquartile range) is the difference between the 3Q and 1Q. (F) Schematic of the process to calculate dAUC as a measurement of the effect of individual motifs on distal cis-regulatory regions prediction ability (right); dAUC values for the motifs shown in D (left).

