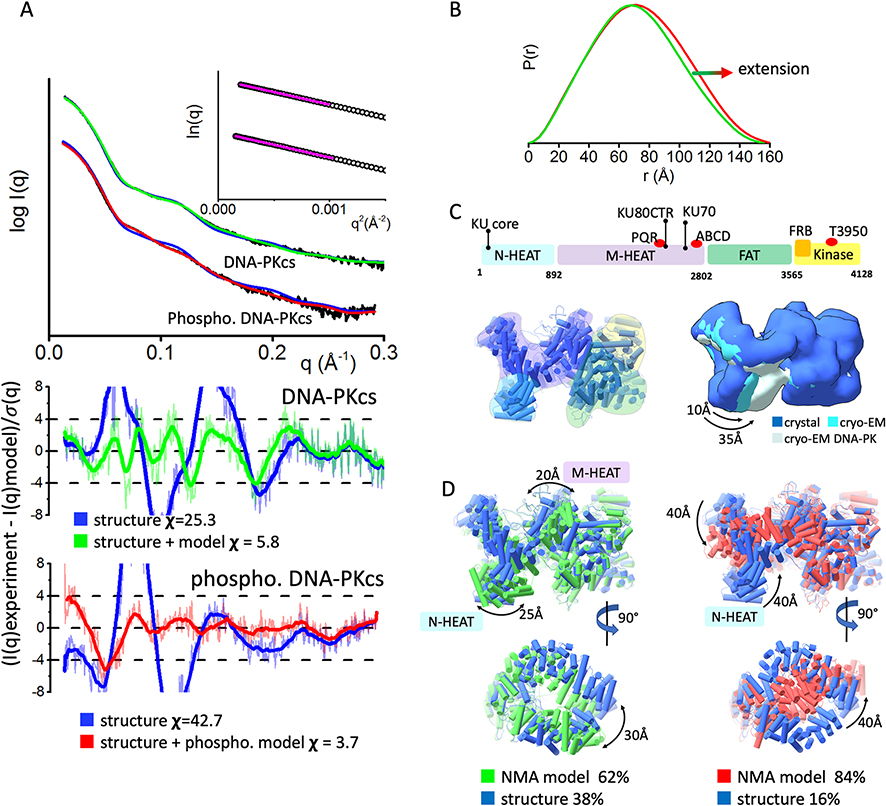
Fig. 2.
Inherent dynamicity of DNA-PKcs HEAT region and its rearrangement during the autophosphorylation.
A) Experimental (black) and theoretical (colored as indicated) SAXS profiles for the solution state models of DNA-PKcs and autophosphorylated DNA-PKcs. SAXS fits are shown together with the fit residuals and goodness of fit values (χ2). Guinier plots for experimental SAXS curves are shown in the inset.
B) Pair distribution P(r) functions, normalized at the maxima, for experimental SAXS curves of DNA-PKcs and autophosphorylated DNA-PKcs (taken from [27]).
C) Top panel: A schematic representation highlighting the four super secondary structural components of DNA-PKcs: the two HEAT region composed of the N-terminal domain (N-HEAT); the M-HEAT region and the Head regions, which contains the FAT and kinase regions. The KU binding area, FRB domain, autophosphorylation clusters PQR and ABCD, and highly conserved T3950 autophosphorylation site are shown above the schematic.
Left panel: Crystal structure of DNA-PKcs with highlighted N-HEAT, M-HEAT, FAT and kinase regions. middle panel: Comparison of the crystal structure and cryo-EM structure from [1, 3], and cryo-EM structure of DNA-PKcs taken from the DNA-PK complex [15]. For better visualization of conformational variability in the HEAT region, atomic models are displayed as a molecular envelop at the 20Å resolution.
D)Two orthogonal views of multi-state model used to match experimental SAXS curves of DNA-PKcs and autophosphorylated DNA-PKcs. The models were superimposed on each other at the FAT region. Weight for each model is indicated.

