Fig. 3.
Formation of dumbbell DNA-PKcs-DNA dimers
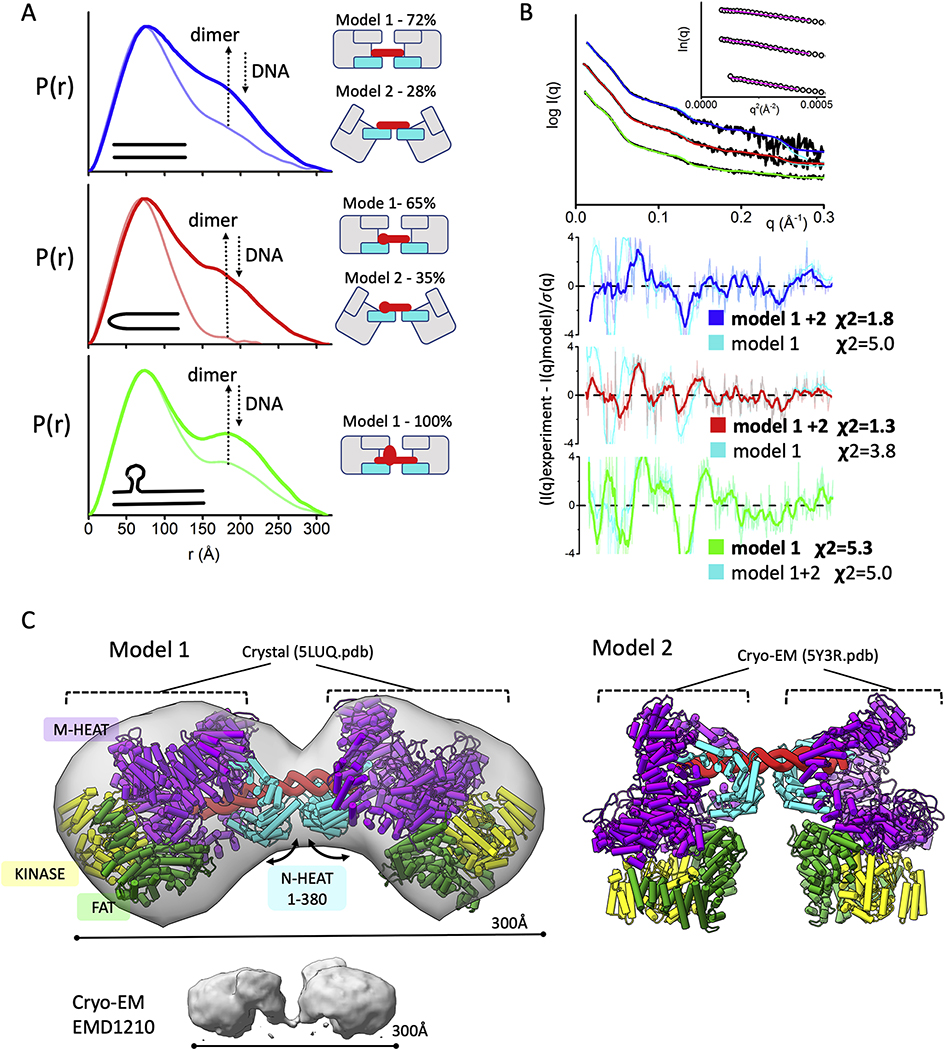
A) P(r) functions for DNA-PKcs - 40bp DNA (blue), 40bp H-DNA (red) and 40bp Y-DNA (green) with the ratio 2:1 (DNA-PKcs :DNA), calculated from the experimental SAXS shown in the panel B. The light-colored P(r) functions are shown for the samples with equimolar DNA-PKcs:DNA molar ratio. The left panel shows cartoon representations of the atomistic models and its weights for each DNA-PKcs-DNA complex that were used to match the SAXS data shown in the panel B.
B) Experimental (black) and theoretical SAXS profiles for the single (cyan) and multistate-model of DNA-PKcs in the complex with 40bp DNA (blue), 40bp H-DNA (red) and 40bp Y-DNA (green) with the DNA-PKcs:DNA ratio 2:1. SAXS fits are shown together with the fit residuals and goodness of fit values (χ2). Guinier plots for experimental SAXS curves are shown in the inset.
C) Two atomistic models of DNA-PKcs dimer (model 1 and model 2) bridged by 40bpDNA(red). Model 2 was built based on the DNA-PK cryo-EM structure [15] by replacing KU with the DNA-PKcs. Model 1 was built by replacing both DNA-PKcs with DNA-PKcs-crystal structure [3]. Conformational variability in the N-HEAT 1–380 region as seen between DNA-PKcs from DNA-PK (PDBID 5Y3R) and DNA-PKcs crystal structure (PDBID: 5LUQ) results in altering of DNA-PKcs tilt. The N-HEAT 1–380, M-HEAT, FAT and kinase regions are colored as indicated. cryo-EM map for putative DNA-PKcs-DNA-KU complex [57] is shown in the bottom panel.

