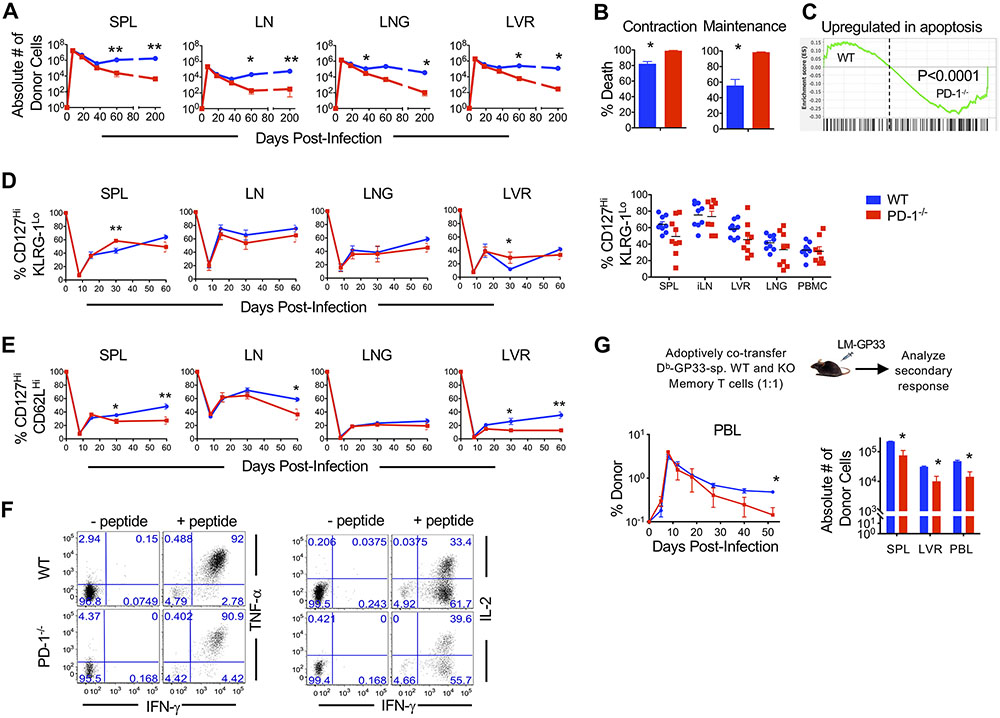
Figure 3. Absence of PD-1 signals in CD8 T cells is associated with increased attrition following antigen clearance.
Equal numbers of WT and PD-1−/− P14 CD8 T cells were adoptively co-transferred at high dose (5x10⁴ cells) into C57BL/6 mice. Mice were infected with LCMVArm and analyzed following infection. (A). Antigen-specific WT and PD-1−/− donor CD8 T cell were enumerated longitudinally in spleen (SPL), lymph node (LN), lung (LNG), and liver (LVR). (B) Bar graphs depict percent death of WT and PD-1−/− donor CD8 T cells in blood during contraction (day 8-22) and maintenance (day 22-200). (C). GSEA analysis shows enrichment of an apoptosis gene signature in day 8 PD-1−/− effector CD8 T cells compared to WT. (D and E) Antigen specific WT and PD-1−/− donor CD8 T cells were analyzed longitudinally for expression of CD127Hi KLRG-1Lo memory-fated (D) and CD127Hi CD62LHi TCM subsets (E) in the indicated tissues. Dot plots show CD127Hi KLRG-1Lo percentages of donors in the respective compartments at day 60 post-infection. Compiled data from two independent repeats with n=3 to 5 mice per group per repeat are presented. (F) Splenocytes were stimulated with GP33 peptide at memory (day 36 post-infection) and donor CD8 T cells were gated. Flow cytometry plots show TNF-α or IL-2 and IFN-γ production by WT and PD-1−/− CD8 T cells. (G) WT and PD-1−/− memory CD8 T cells were isolated from splenocytes at day 22 post-infection, and equal numbers were transferred into naïve C57BL/6 recipients at 104 cells per mouse. Mice received a heterologous challenge with LM-GP33. The line graph depicts kinetics of donor CD8 T cells in PBMCs of infected mice. Bar graphs show number of donors in respective tissues at day 52 post-infection. Bar graphs display mean and SEM. Data are representative of 2 to 3 independent experiments with n=3 to 5 mice per group. Paired t-test was used with statistical significance in difference of means represented as *P ≤ 0.05, **P ≤ 0.01.

