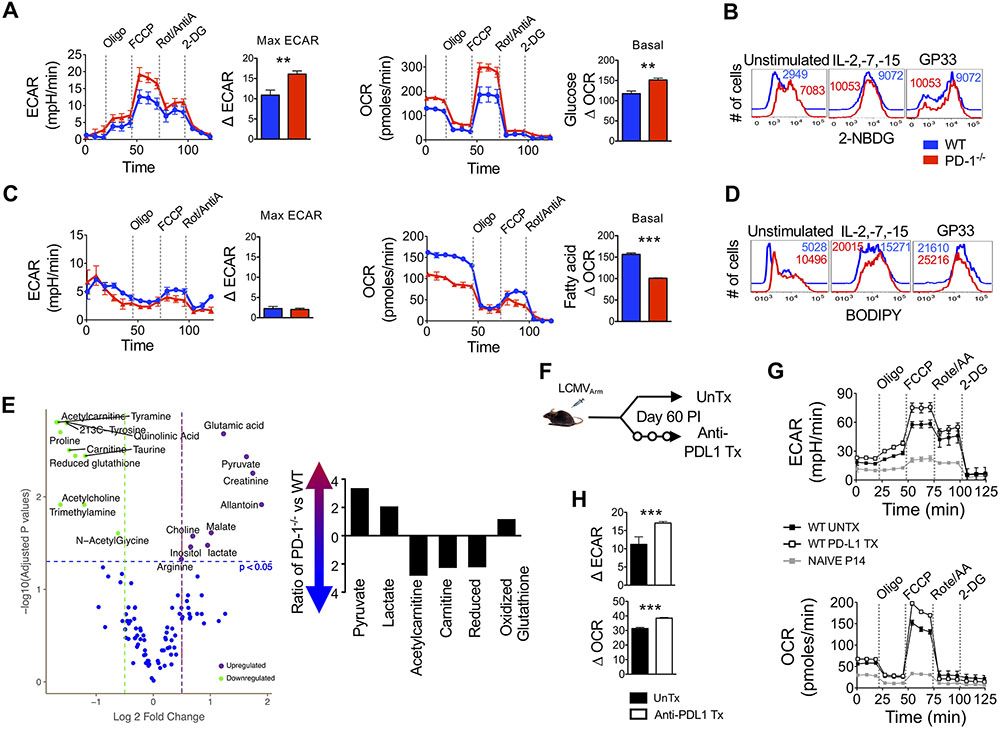
Figure 5. PD-1 signals drive a metabolic switch in CD8 T cells for maintenance of a quiescent memory phenotype.
Equal numbers of WT P14 and PD-1−/− P14 antigen-specific CD8 T cells were adoptively transferred (5x10⁴ cells) into C57BL/6 mice and mice were infected with LCMVArm. At day 60 post-infection memory donor cells were purified and T cell metabolism was analyzed. (A) Metabolic analysis was performed on WT and PD-1−/− donor CD8 T cells in the presence of 10mM glucose with indicated additions of oliomycin (oligo), Trifluoromethoxy carbonylcyanide phenylhydrazone (FCCP), Rotenone and antimycin A (Rot/AntiA) and 2-deoxyglucose (2DG). Line graphs show extracellular acidification (ECAR) and oxygen consumption (OCR) rates over time. Bar graphs depict maximum ECAR and basal OCR values. (B) Memory CD8 T cells were incubated with common γ-chain cytokines or unlabeled H-2Db:GP33 tetramer for 36 hours and then glucose uptake (2-NBDG) was analyzed. Representative histograms show WT (blue) or PD-1−/− (red) donor cells. Numbers represent MFI. (C) Metabolic analysis was performed on WT and PD-1−/− donor CD8 T cells in the presence of bovine serum albumin (BSA) linked fatty acids. Line graphs show ECAR and OCR values over time. Bar graphs depict maximum ECAR and basal OCR values. (D) Memory CD8 T cells were incubated with common γ-chain cytokines or unlabeled H-2Db:GP33 tetramer for 36 hours and then fatty acid (BODIPY) content was analyzed. Representative histograms show WT (blue) or PD-1−/− (red) donor cells. Numbers represent MFI. (E) A volcano plot shows fold change in metabolite values for 110 tested metabolite concentrations in purified WT and PD-1−/− memory CD8 T cells with respect to p-values depicting significance of change. Significantly different metabolites are highlighted. Bar graph shows selected metabolite ratios between PD-1−/− and WT memory CD8 T cells. (F) WT P14 CD8 T cells were transferred (105 cells) into naïve C57BL/6 mice, which were subsequently infected with LCMVArm. Mice were untreated (UnTx) or treated with anti-PD-L1 following day 60 post-infection for two weeks. (G) An XF Seahorse analysis was performed on UnTx and anti-PD-L1 Tx donor memory CD8 T cells in the presence of 10mM glucose. Line graphs show ECAR and OCR. (H) Bar graphs show maximum ECAR and basal OCR. Paired (A and C) and unpaired (H) Student’s t-tests were used with statistical significance in difference of means represented as **P ≤ 0.01, ***P ≤ 0.001. Experiments are representative of 2 to 3 experiments with n=3 to 5 mice per group.

