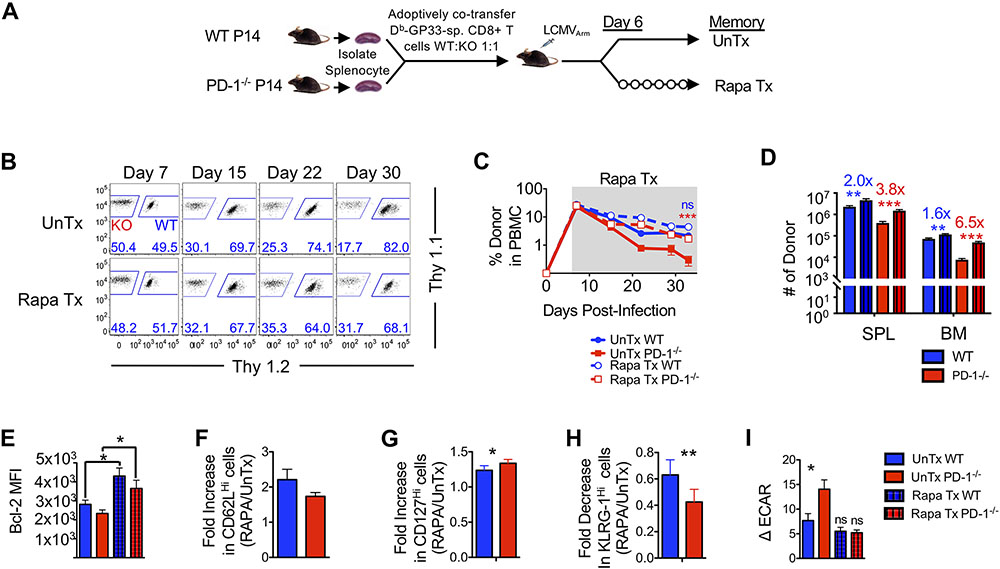
Figure 6. Rapamycin treatment after infection rescues memory attrition in the absence of PD-1 signals.
(A) Equal numbers of WT and PD-1−/− P14 CD8 T cells were adoptively co-transferred (5x10⁴) into C57BL/6 mice. Mice were infected with LCMVArm and remained untreated or were treated with Rapamycin (Rapa) daily starting at day 6 post-infection. (B) Flow cytometry plots are gated on donor CD8 T cells and show frequencies of WT and PD-1−/− donors in PBMCs. (C) Line graph depicts frequency of donors in PBMC during rapamycin treatment. (D) Bar graphs show number of donor cells in spleen (SPL) and bone marrow (BM) at day 33 post-infection. Numbers above bar graphs represent fold-change of rapamycin treated by untreated WT (blue) and PD-1−/− (red) respectively day 33 post-infection. (E) Bar graph shows MFI of Bcl-2 at day 33 post-infection on gated donor cells. (F to H) Bar graph depicts fold-increase in CD62LHi (F) and CD127Hi (G) and decrease in KLRG-1Hi (H) donor CD8 T cells in spleens from rapamycin-treated animals at day 33 post-infection relative to untreated controls. (I) An XF Seahorse analysis was performed on untreated and rapamycin-treated donor CD8 T cells in the presence of 10mM glucose. Bar graph shows basal ECAR in donor cells. Paired (E, F, and G) and unpaired (B, C, D, and G) Student’s t-test was used with statistical significance in difference of means represented as *P ≤ 0.05, **P ≤ 0.01, ***P ≤ 0.001. ns, not significant. Data are representative of 2 experiments with n=3 to 5 mice per group.

