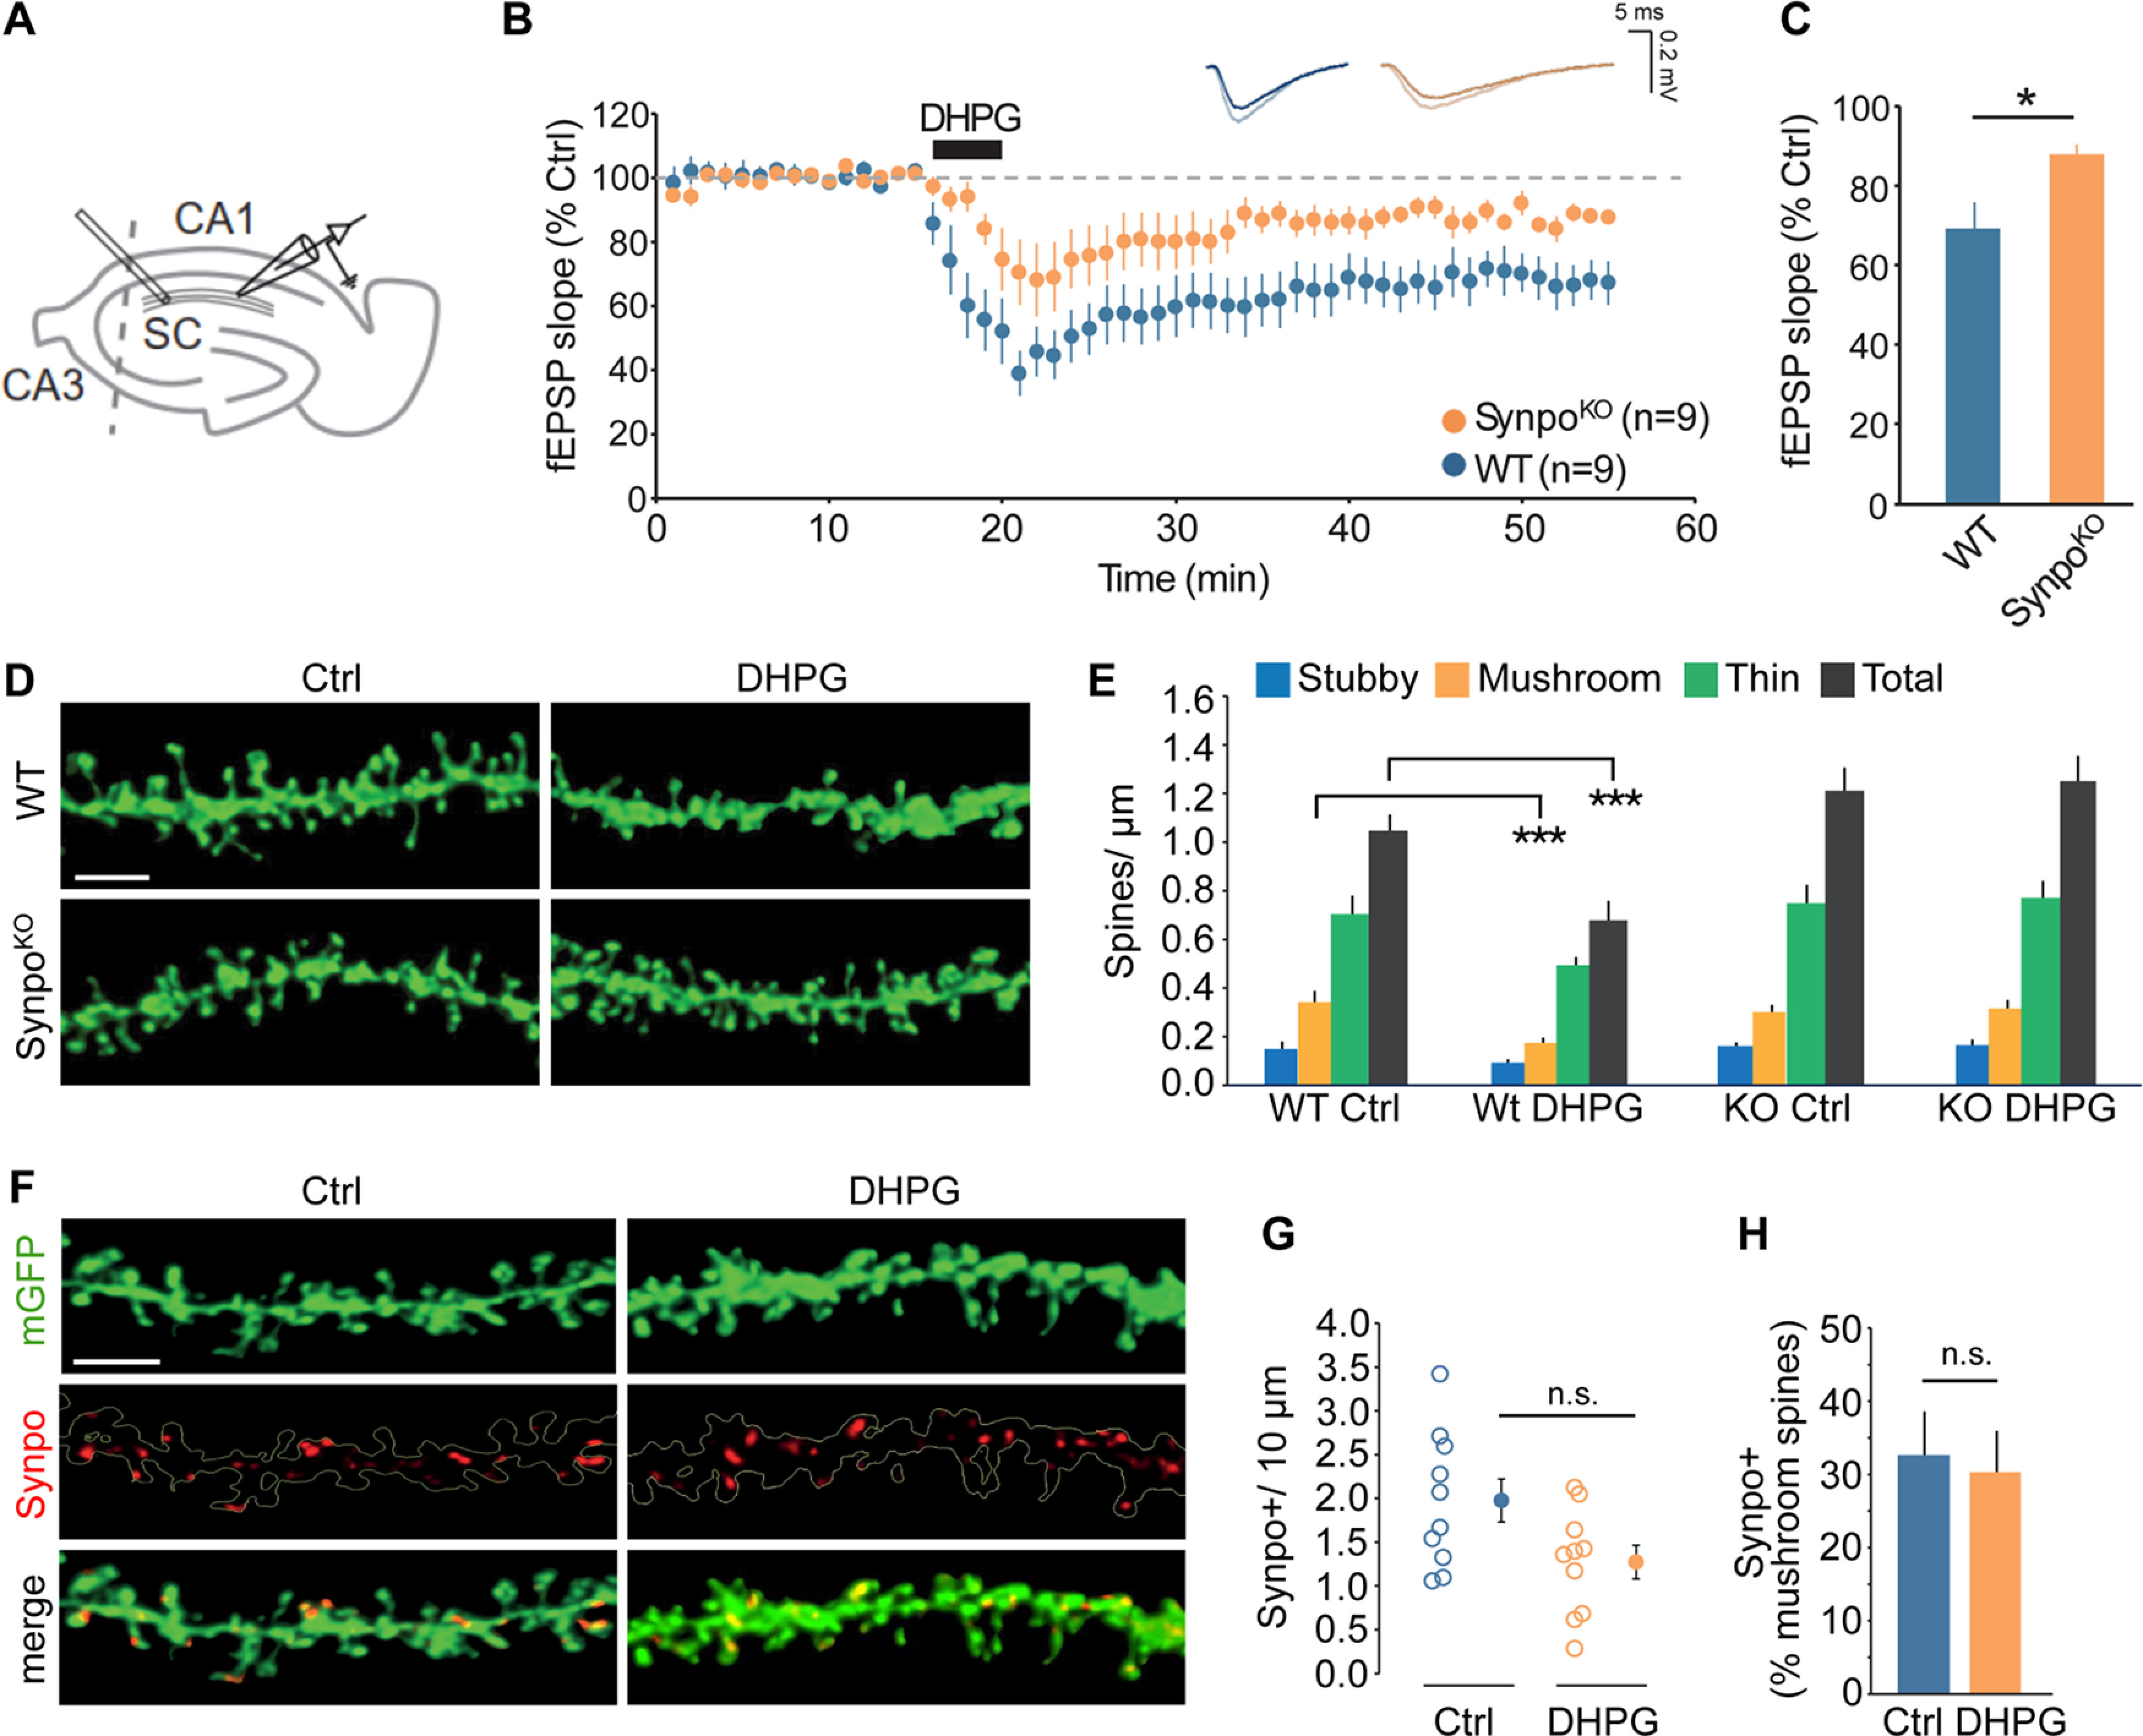
Figure 1.

Spines with stable Synpo are required for mGluR-LTD. A, Illustration of the approximate locations of stimulating and recording electrodes in hippocampal slices to measure mGluR-LTD at SC to CA1 synapses. B, Time course of synaptic changes induced by bath application of 100 μm DHPG during 5 min in WT (n = 9 slices, N = 4 mice) and SynpoKO mice (n = 9 slices, N = 5 mice). Shown are representative field potentials before and after DHPG. C, Quantification of average mGluR-LTD in the last 10 min of the recording. Data are mean ± SEM. SynpoKO 87% ± 3, WT 69% ± 6, n = 9 slices. p < 0.05 (Mann–Whitney test). D, Representative images of dendritic spine density in WT and SynpoKO acute hippocampal slices treated with vehicle (Ctrl) or DHPG. Scale bar, 3 μm. E, Quantification of total spine density and individual spine type density per micron. Total spine density: WT-Ctrl (n = 10), 1.05 ± 0.07, WT-DHPG (n = 10), 0.68 ± 0.08, SynpoKO-Ctrl (n = 9), 1.21 ± 0.09, SynpoKO-DHPG (n = 9), 1.25 ± 0.10. Stubby spine density: WT-Ctrl 0.16 ± 0.03, WT-DHPG 0.09 ± 0.01, SynpoKO-Ctrl 0.16 ± 0.01, SynpoKO-DHPG 0.17 ± 0.02. Mushroom spine density: WT-Ctrl 0.34 ± 0.05, WT-DHPG 0.17 ± 0.02, SynpoKO-Ctrl 0.30 ± 0.03, SynpoKO–DHPG 0.31 ± 0.03. Thin spine density: WT-Ctrl 0.70 ± 0.07, WT-DHPG 0.49 ± 0.03, SynpoKO-Ctrl 0.75 ± 0.07, SynpoKO-DHPG 0.77 ± 0.07. WT-Ctrl versus WT-DHPG: ***p < 0.001 (Mann–Whitney). F, Representative images showing Synpo localization in dendritic spines in WT hippocampal acute slices treated with control or DHPG. Scale bar, 3 μm. G, Quantification of Synpo+ spines in neurons in control (Ctrl) or DHPG-treated neurons. Spines/10 μm. Data are mean ± SEM. WT-Ctrl: 1.97 ± 0.25, WT-DHPG: 1.27 ± 0.19 (Mann–Whitney, not significant). H, Percentage of Synpo+ spines relative to total mushroom spines in neurons treated with control or DHPG: WT-Ctrl 32.6% ± 6.0, WT-DHPG 30.3% ± 5.6 (Mann–Whitney, not significant).
