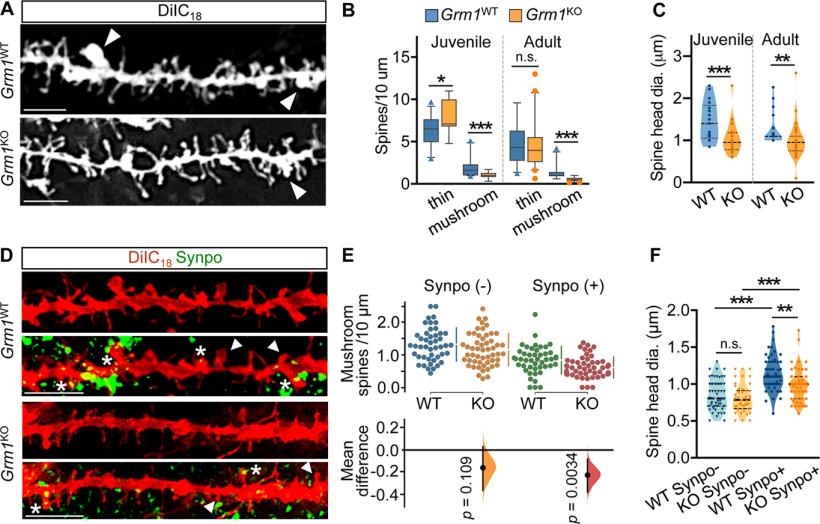
Figure 8.
Reduced density and enlargement of mushroom spines with stable Synpo in mice lacking mGluR1. A, Representative images of DiIC18-labeled dendritic branches in the brain cortex of adult Grm1WT and Grm1KO mice: arrowheads point to mushroom spines. Scale bars, 10 μm. B, Quantification of spine density per 10 μm in the cortex of Grm1WT and Grm1KO mice from images as in A. Juvenile (∼1.5 months old), mean ± SD thin spines WT 6.8 ± 1.7 (n = 32 dendritic branches), KO 7.8 ± 1.9 (n = 25). *p = 0.025. Mushroom spines WT 1.9 ± 0.98 (n = 34), KO 1.10 ± 0.39 (n = 19), N = 2 mice per group. ***p < 0.001. Adult mice (∼7-12 months old), mean ± SD thin spines WT 4.7 ± 2.2 (n = 36), KO 4.4 ± 2.5 (n = 46) (not significant) p = 0.29; mushroom spines WT 1.4 ± 0.87 (n = 31), KO 0.54 ± 0.25 (n = 39), WT N = 5, KO N = 4 mice. ***p < 0.001, Mann–Whitney test. C, Quantification of mushroom spine head dimensions (diameter) in Grm1WT (WT) and Grm1KO (KO) mice. Juvenile, mean ± SD, WT 1.5 ± 1.7 μm (n = 21), KO 1.0 ± 0.36 μm (n = 25). ***p = 0.001. Adult, mean ± SD, WT 1.2 ± 0.38 (n = 20), KO 1.0 ± 0.40 (n = 40). **p = 0.003, Mann–Whitney test. D, Representative images of dendritic branches labeled with DiIC18 and anti-Synpo in the brain cortex of adult Grm1WT and Grm1KO mice. Arrowheads point to Synpo- mushroom spines. Asterisks indicate Synpo+ mushroom spines. Scale bar, 5 μm. E, Quantification of the density per 10 μm of Synpo– and Synpo+ mushroom spines in the cortex of adult Grm1WT (WT) and Grm1KO (KO) mice from images as in D. Data are mean ± SD. Synpo– spines WT 1.3 ± 0.51 (n = 46 dendritic branches), KO 1.2 ± 0.5 (n = 53); Synpo+ spines WT 0.85 ± 0.42, KO 0.62 ± 0.32 from 3 mice per group. Gardner–Altman estimation plot: mean difference (dot, bottom) is plotted on a floating axis as a bootstrap sampling distribution. Vertical error bars indicate the 95% CI (two-sided permutation t test). F, Quantification of head dimensions (diameter) of Synpo– and Synpo+ mushroom spines in Grm1WT (WT) and Grm1KO (KO) adult mice. Data are mean ± SD. Synpo– WT 0.85 ± 0.21 μm (n = 50), KO 0.8 ± 0.19 μm (n = 44); Synpo+ WT 1.1 ± 0.23 μm (n = 54), KO 0.98 ± 0.23 μm (n = 49) from 3 mice per group. **p = 0.002; ***p < 0.001; one-way ANOVA with Tukey's post-test.

