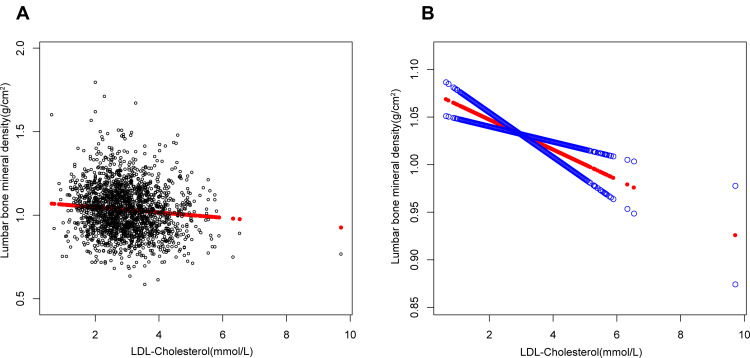
Figure 1.
The association between low-density lipoprotein cholesterol and lumbar bone mineral density. (A) Each black point represents a sample. (B) Solid red line represents the smooth curve fit between variables. Blue bands represent the 95% of confidence interval from the fit. Age, gender, race, educational level, BMI, family income-to-poverty ratio, moderate activities, smoking at least 100 cigarettes over the life period to the point of data collection, diabetes status, hypertension status, ALT, AST, total calcium, blood urea nitrogen, serum uric acid, and serum phosphorus were adjusted.

