Figure 1:

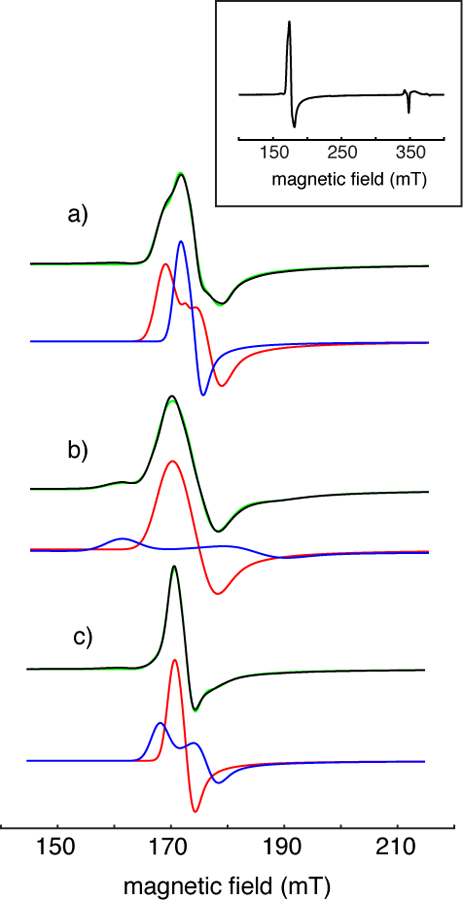
Cw-EPR spectra (black traces) showing the g = 4 region of (a) TauD[taurine]NO, (b) TauD[2-OG]NO and (c) TauD[taurine, 2-OG]NO. The inset shows a full spectrum of TauD[taurine]NO. Parameters for data acquisition that were common for all three spectra are: microwave frequency, 9.68 GHz; microwave power, 6.3 μW; sample temperature, 4.0 K; field modulation amplitude, 0.8 mT; field modulation frequency, 10 kHz; sample probe, Bruker MD5. The red and blue traces are spectral simulations for the majority and minority species, respectively, obtained using the spin Hamiltonian parameters provided in Table 1. These sub-spectra are scaled and offset to aid visualization, when combined (green traces) they yielded simulations with values that ranged from 0.6 – 0.9.
