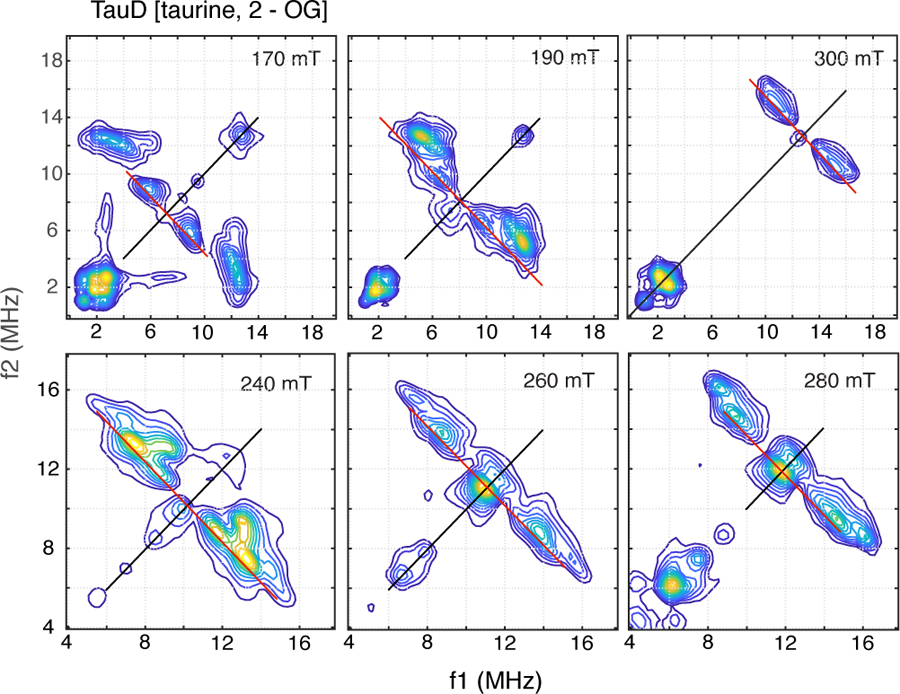
Figure 2:

HYSCORE spectra of TauD[taurine, 2-OG]NO collected at field positions ranging from 170 mT to 300 mT. Contour plots were made using a cut-off threshold that varied from 5 – 15% of the maximum amplitude displayed in the plotting window. Data were collected at 9.6862 GHz using the following timing parameters: τ, 136 ns (170 mT), 124 ns (190 mT), 96 ns (240 mT), 92 ns (260 ns), 84 ns (280 mT), 156 ns (300 mT); starting values for t1 and t2, 40 ns; time increment, 16 ns.
