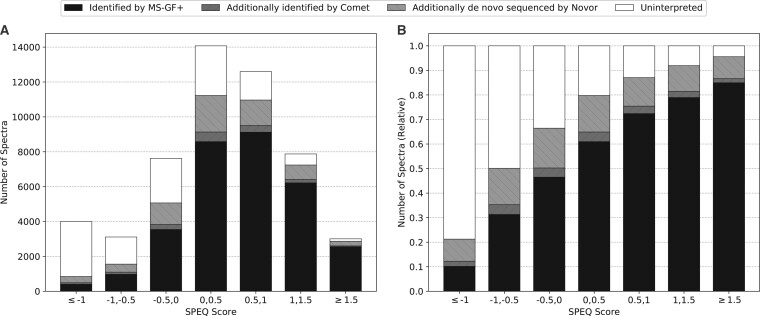
Fig. 7.
(A) The number of identified and unidentified spectra in different intervals of the quality score assigned by SPEQ. (B) The relative ratio of identified and unidentified spectra in different intervals of the SPEQ score. The SPEQ score used in this figure is the logit of the probability predicted by SPEQ. The black, dark gray and light gray bars represent the spectra identified by MS-GF+, Comet but not MS-GF+, and Novor but not the other two tools, respectively. The white bars represent the spectra unidentified by any of the three tools

