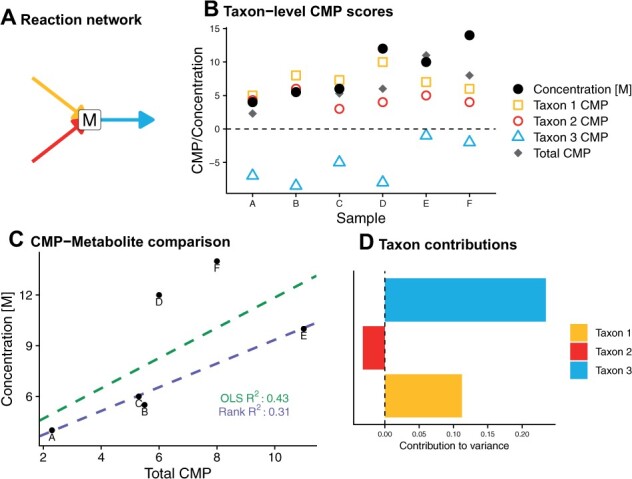
Fig. 2.

An example contribution analysis of hypothetical metabolite M. (A) In this toy example, metabolite M is produced by two taxa and utilized by a third. (B) Overview of CMP scores and metabolite measurements for metabolite M across a dataset of six samples. Taxon-level CMP scores are based on the estimated ability of each species to synthesize/utilize the metabolite and on the abundance of the taxon in the sample. (C) Comparison of CMP scores and measurements of M across this dataset. The solution found by OLS regression is affected more strongly by the outlier samples D and F than that found by rank-based regression. (D) Final summary contribution plot for metabolite M using the rank-based regression option. The bars represent the contributions to metabolite variance explained by each taxon. Most of the variance is attributed to differences in the amount of utilization of M by Taxon 3 across samples, reflecting the larger variability in Taxon 3’s CMP scores shown in panel (B)
