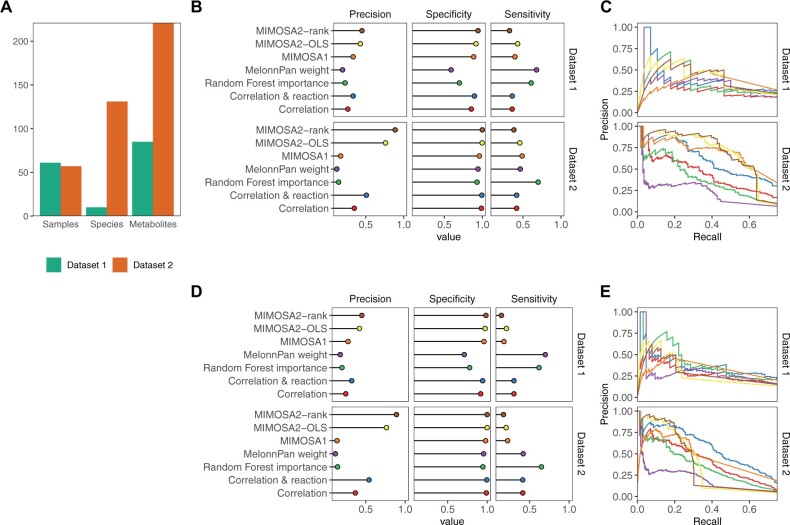
Fig. 4.
Identification of key microbe–metabolite contributions by MIMOSA2 from simulated datasets. (A) Descriptive summary statistics for the two simulated datasets analyzed, including number of samples, species and metabolites included. (B) Precision, specificity and sensitivity of MIMOSA2 analysis for recovering true key microbial contributors to metabolite variation from metabolites identified as potentially microbiome-governed by MIMOSA2 in two simulated datasets, compared with correlation-based approaches, MIMOSA version 1, MelonnPan L1 linear models (Mallick et al., 2019) and feature importance from a cross-validated random forest regression (RF) (Muller et al., 2021). Standard thresholds were used to designate contributors for each method (correlation: 0.01 q-value, MIMOSA2: 5% contribution, MIMOSA1: correlation >0.25 and q-value <0.1, MelonnPan: non-zero model weight, RF: Altman P-value <0.1). (C) Precision-recall curves for identifying key contributors for the same set of metabolites in simulated Datasets 1 and 2 as in panel (B), by MIMOSA2 and the same alternative correlation-based methods. Colors for each method are the same as labeled in panel (B). (D) Precision, specificity and sensitivity of MIMOSA2 analysis for recovering true key microbial contributors to metabolite variation [as in panel (B)], but for all metabolites. All thresholds are the same as above. (E) Precision-recall curves for identifying key taxon–metabolite contributors in simulated Datasets 1 and 2, as in panel (C), but for all metabolites

