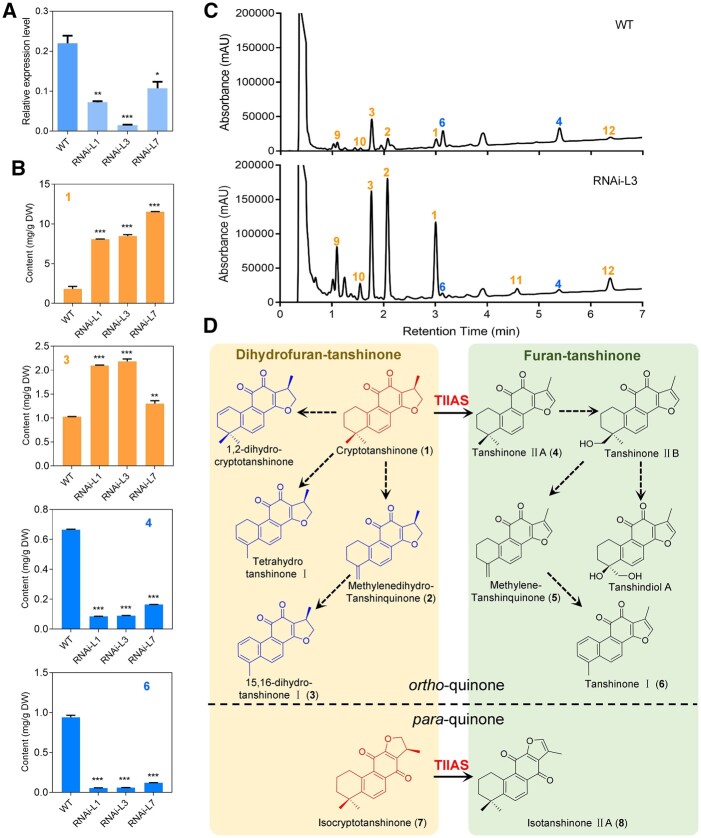
Figure 4.
The effects of SmTⅡAS silencing by RNAi on the accumulation of tanshinones. A, Relative expression of SmTⅡAS in the RNAi hairy root lines detected by RT-qPCR (reverse transcription quantitative PCR). B, Contents of four tanshinones in the RNAi hairy roots (numbers shown in the panels correspond with the numbered compounds in (D). Data are means ± sd of three biological replicates. Statistical analysis was performed with Student’s t test. C, UPLC comparison of the WT and the RNAi hairy roots, line 3 (RNAi-L3). The mass spectra of the compounds were given in Supplementary Figure S5. Orange color and blue color indicate the increased and decreased content of compounds in the RNAi line, respectively. D, The catalytic role of SmTⅡAS in converting dihydrofuran-tanshinones to furan-tanshinones. The structures in red, but not those in blue, were accepted by SmTⅡAS. Peaks in the total ion chromatograms of (C) are numbered and assigned to corresponding structures (with identical numbers) in (D) while peaks marked with 9–12 could not be assigned structures, and the corresponding mass spectra were given in Supplemental Figure S5.

