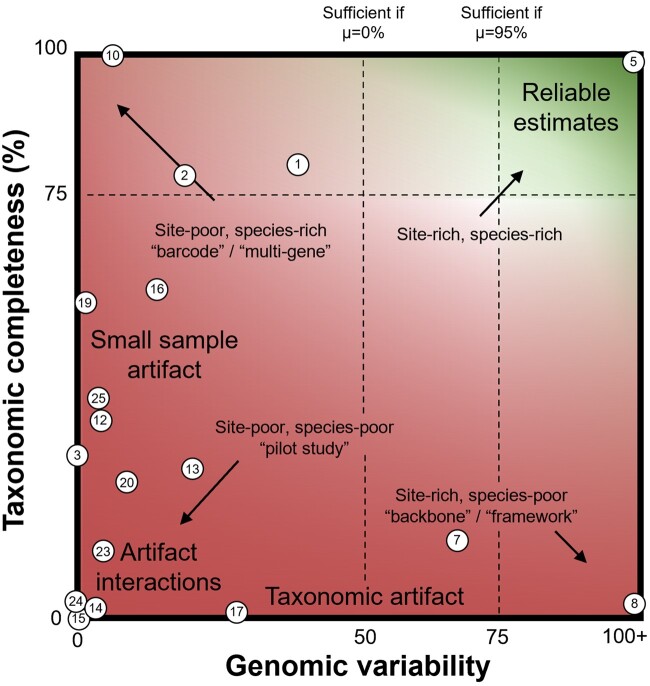
Fig. 6.
Thresholds of data richness needed to infer speciation rates reliably. The horizontal axis represents genomic variability (ratio of variable sites/number of species). The vertical axis represents taxonomic completeness (species sampling fraction of the timetree). Numbered dots represent the studies examined for which the data were available and compatible with this schematic, with numbers following table 3 for all studies which could be plotted.

