Figure 4.
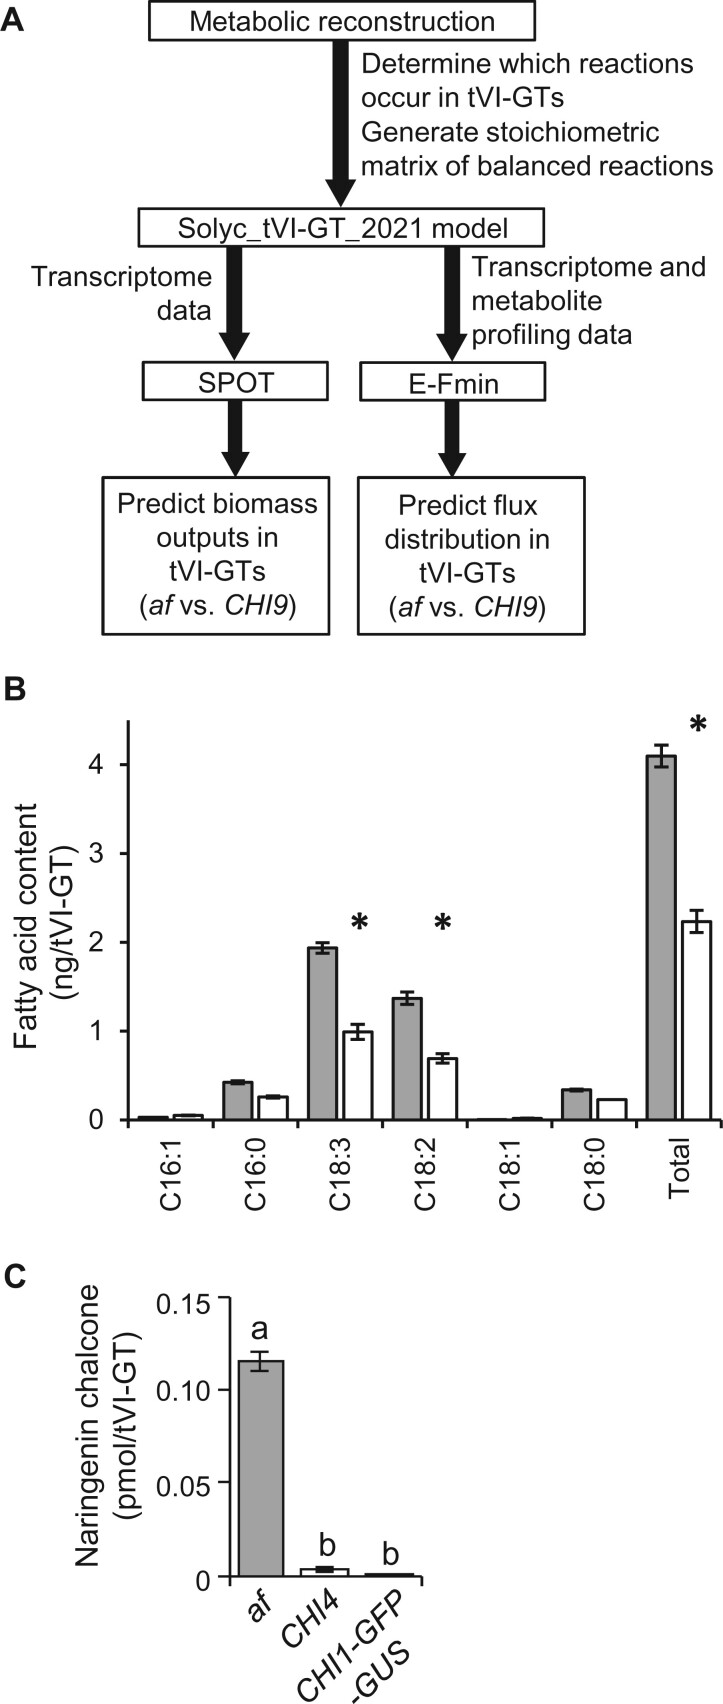
Experimental testing of predictions of a mathematical model of metabolism in tomato tVI-GTs. A, Overview of workflow for generating the Solyc_tVI-GT_2021 model. B, Quantitative fatty acid analysis of isolated tVI-GTs from the af mutant (gray bars) and CHI9 isogenic control (open bars) to test the Solyc_tVI-GT_2021 prediction that flux through fatty acid biosynthesis is higher in the af mutant compared to CHI9. Asterisks denote P < 0.01 in comparisons between af and CHI9 (n = 5–6). C, Comparison of the amount of naringenin chalcone in tVI-GTs of the indicated genotypes (n = 8–15 collections of hand-picked trichomes per genotype) to test the Solyc_tVI-GT_2021 prediction that only the flavonoid pathway reactions upstream of CHI1, but not those downstream, carry significant flux in the af mutant. Bars represent mean ± standard error. Statistical difference across genotypes, based on Tukey’s multiple comparison test (P < 0.05), is indicated by lowercase letters.

