Figure 6.
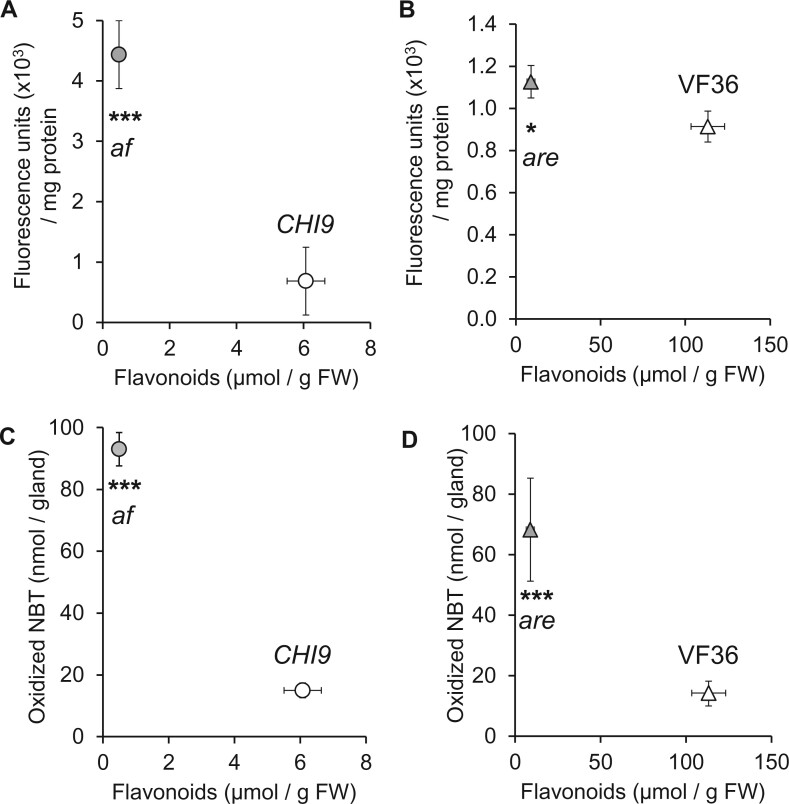
Loss of flavonoids in tomato af and are mutants correlates with increased levels of ROS. A, Flavonoid-to-ROS correlation (measured as fluorescent signal generated by oxidation of the H2DCFDA reagent) in the af mutant (gray circle) and CHI9 control (open circle). B, Flavonoid-to-ROS correlation in the are mutant (gray triangle) and VF36 parent (open triangle). C, Flavonoid-to- correlation (measured as oxidized NBT) in the af mutant (gray circle) and CHI9 control (open circle). D, Flavonoid-to-ROS correlation in the are mutant (gray triangle) and VF36 parent (open triangle). Data points represent the average, with bars corresponding to standard error (if invisible, error bars are smaller than symbol) (n = 5). Statistical significance of pairwise comparisons based on a Student’s t tests is indicated by asterisks (*P ≤ 0.01; **P ≤ 0.001; ***P ≤ 0.001).

