
Fig 4. DR5 signal is compromised in pin3 ovules at floral stage 10.
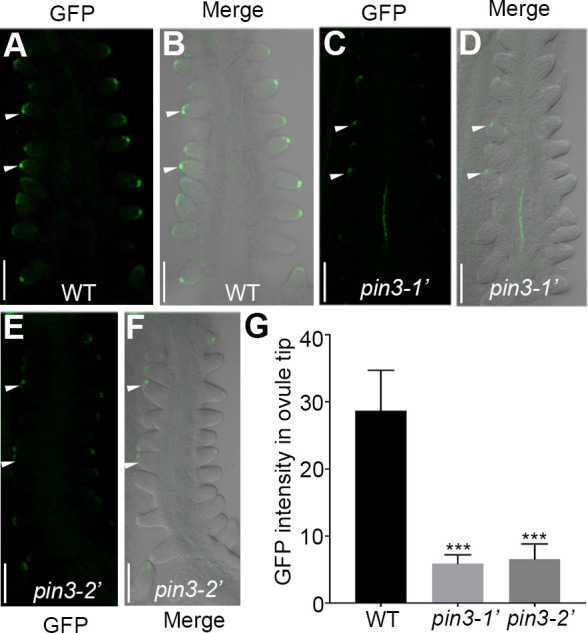
(A-F) Confocal microscopy observations of the DR5::NLS-eGFP reporter in the wild-type (A-B), pin3-1’ (C-D), and pin3-2’ (E-F) backgrounds. (G) Quantification of DR5 fluorescence intensity in the ovule tip. Ten independent pistils were analysed. Bars: 50 μm. White arrows indicate the representative ovules for fluorescence intensity analysis. Data are presented as the mean ± SD. Significant differences were revealed by one-way ANOVA (*** P < 0.001).