
Figure 1.
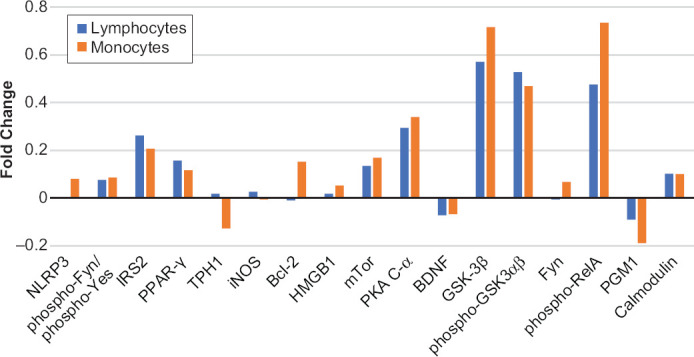
Fold change (FC) of 17 Analytes at Baseline between Lithium Responders and Non-Responders in CD4+ Lymphocytes (blue bars) and Monocytes (brown bars). FC = log2 (median fluorescent intensity of non-responders/median fluorescent intensity of responders)
Note: Positive value is indicative of a higher level of protein expression in lithium non-responders than in lithium responders. Negative value is indicative of a lower level of protein expression in lithium non-responders than in lithium responders.
Abbreviations: Bcl-2, B-cell lymphoma 2; BDNF, brain-derived neurotrophic factor; Calmodulin, calcium-modulated protein; GSK-3β, glycogen synthase kinase 3 beta (Ser9); HMGB1, high mobility group box 1 protein; iNOS, inducible isoform nitric oxide synthase; IRS2, insulin receptor substrate 2; mTor, the mammalian target of rapamycin; Phospho-RelA, phosphorylated nuclear factor NF-kappa-B p65(Ser536) subunit; NLRP3, NACHT, LRR and PYD domains-containing protein 3; Phospho-Fyn/Yes, phosphorylated-Fyn (Y530)/phosphorylated Yes(Y537); PGM1, phosphoglucomutase 1; Phospho-GSK3αβ, phosphorylated glycogen synthase kinase 3 alpha(Tyr279)beta(Tyr216); PKA C-α, protein kinase A catalytic subunit alpha; PPAR-γ, peroxisome proliferator-activated receptor gamma; TPH1, tryptophan hydroxylase 1.