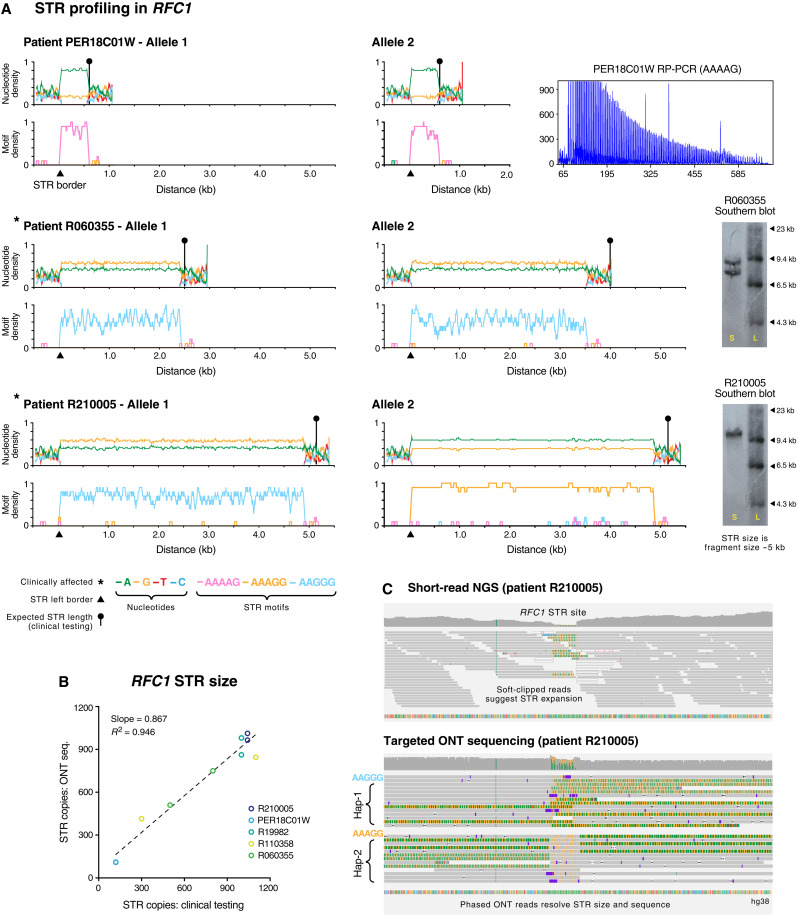
Fig. 3. Haplotype-resolved assembly of pathogenic STR site RFC1.
(A) Line plots show nucleotide content (top) and density of pentanucleotide STR motifs (bottom) enumerated in a 50-bp sliding window across assembled STR alleles (including 1-kb up/downstream flanking sequences). Data are shown for three consenting individuals that were subjected to clinical testing for STR expansions in RFC1. Relevant molecular testing data (RP-PCR or Southern blot) are shown for each individual (see table S3). Asterisks indicate CANVAS-affected patients, triangles show the position of the left border of assembled STRs, and circular markers show the expected length of STR alleles, as determined by clinical testing. (B) Scatterplot shows lengths of pentanucleotide STR alleles in RFC1 in consenting individuals (n = 5), as determined by ONT sequencing versus molecular testing. (C) For patient R210005, genome browser views show short-read NGS alignments (top) at the pathogenic STR site in RFC1. The presence of soft-clipped bases suggests that an STR expansion is present, but the size, sequence, and allelicity cannot be directly determined. Bottom panel shows phased ONT alignments from the same sample. Long reads directly measure the STR expansion size and reveal distinct motif conformations on the two RFC1 alleles.

