
Figure 1. GC-MS full scan analysis of petroleum UVCB products included in this study.
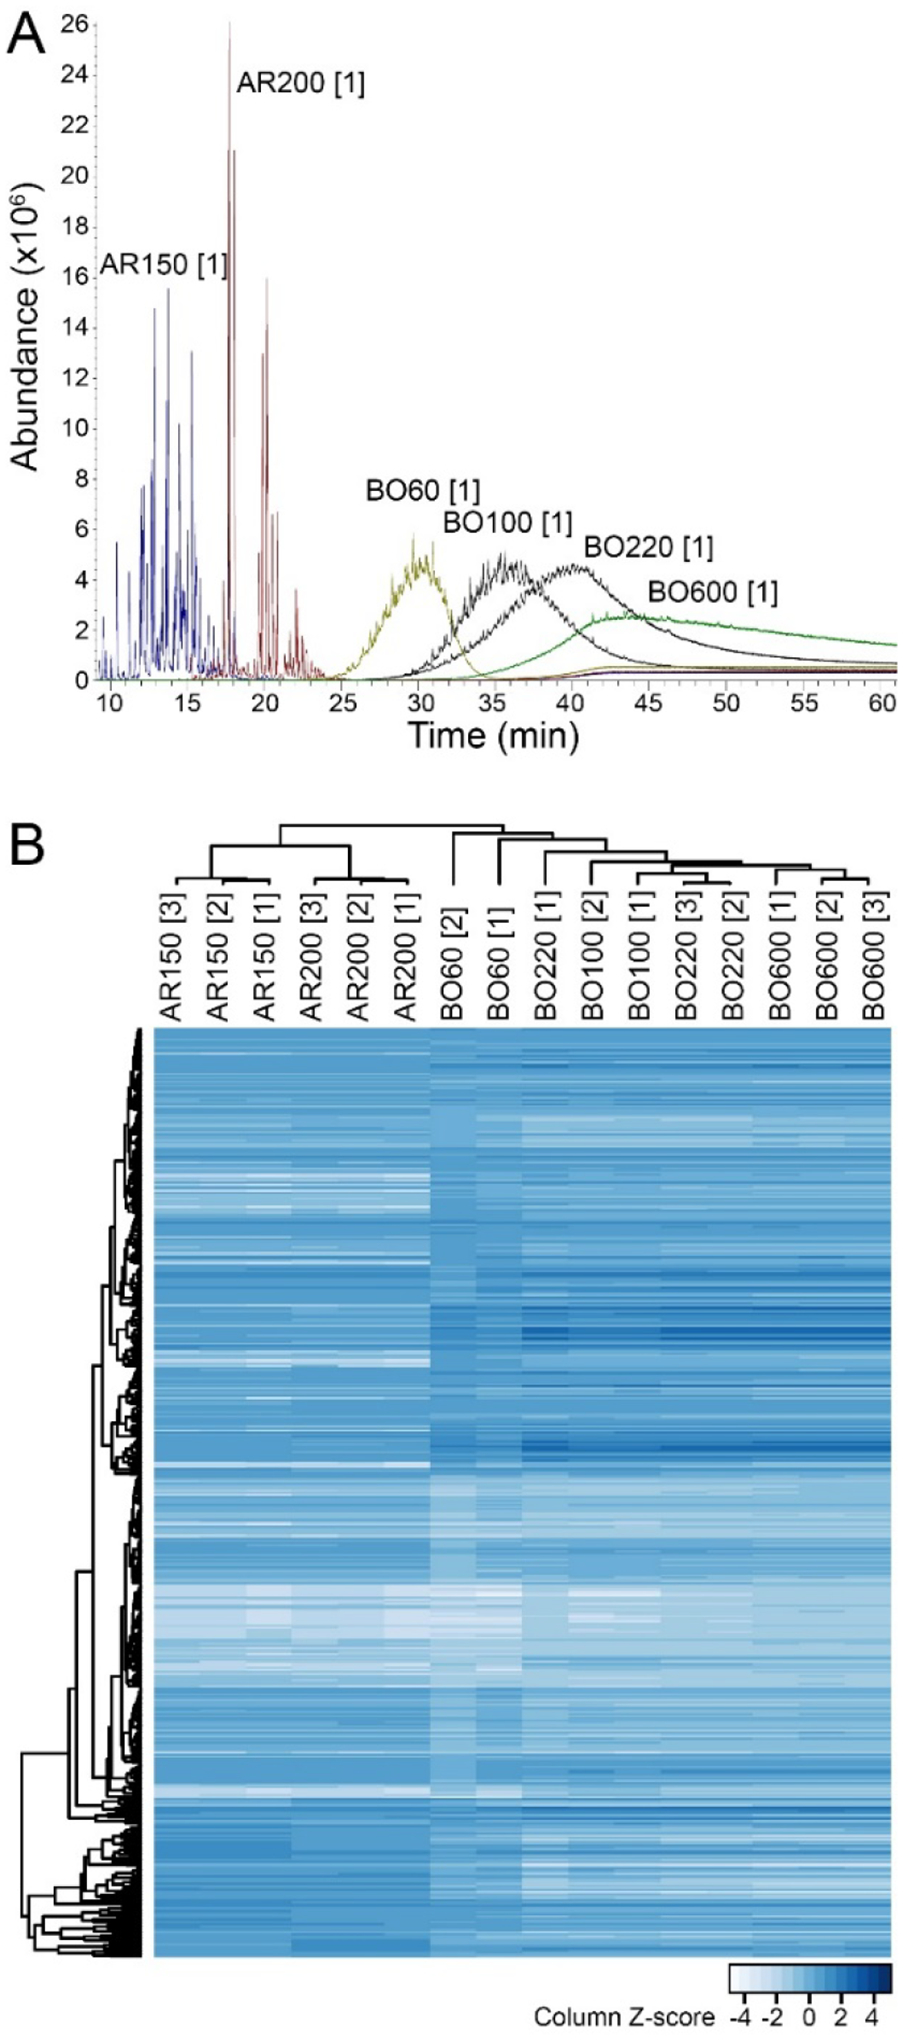
(A) Superimposed GC-MS total ion chromatograms (time vs. abundance) for representative samples (see Table 1 for sample annotations). Individual chromatograms for each sample are shown in Supplemental Figure 1. (B) Hierarchical clustering analysis of the average abundance of the detected compound ion fragments in a mass range of 40–500 amu in 10,127 scans (see Supplemental Table 2 for the raw data). Both samples (columns) and features (rows) were clustered (Spearman correlation, average linkage method). Feature abundance was z-scaled for each sample with lower abundance features indicated by light blue and higher abundance features indicated by dark blue colors.