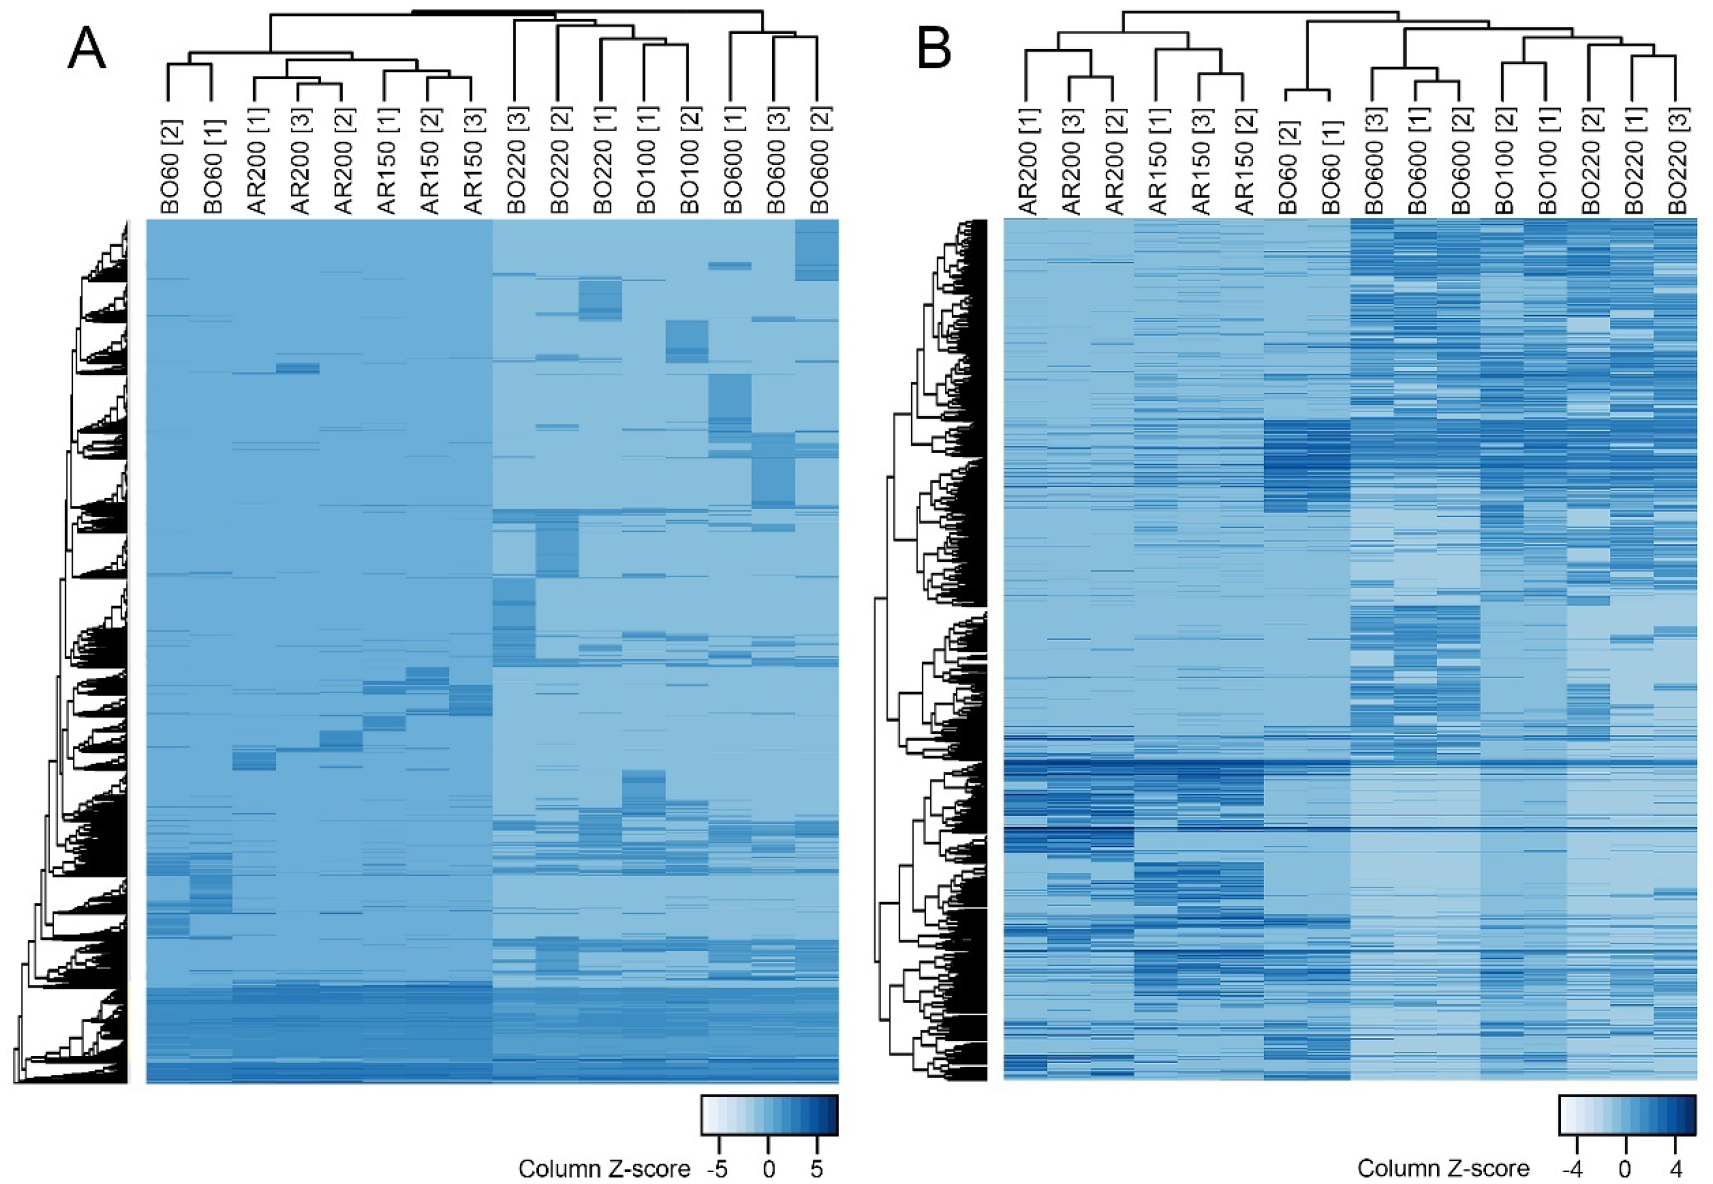
Figure 3. Unsupervised hierarchical clustering of petroleum UVCB products using IMS-MS data.

Shown are heatmaps (illustrating relative feature abundance) that were products of hierarchical clustering analysis (Spearman correlation, average linkage method) for 16 samples (see Table 1 for sample annotations) analyzed in one of the experimental runs. Technical replicates of each sample were averaged for each feature. (A) Full dataset (Supplemental Table 3A; 55,466 features). (B) Filtered dataset (Supplemental Table 4A; 1,530 features).
