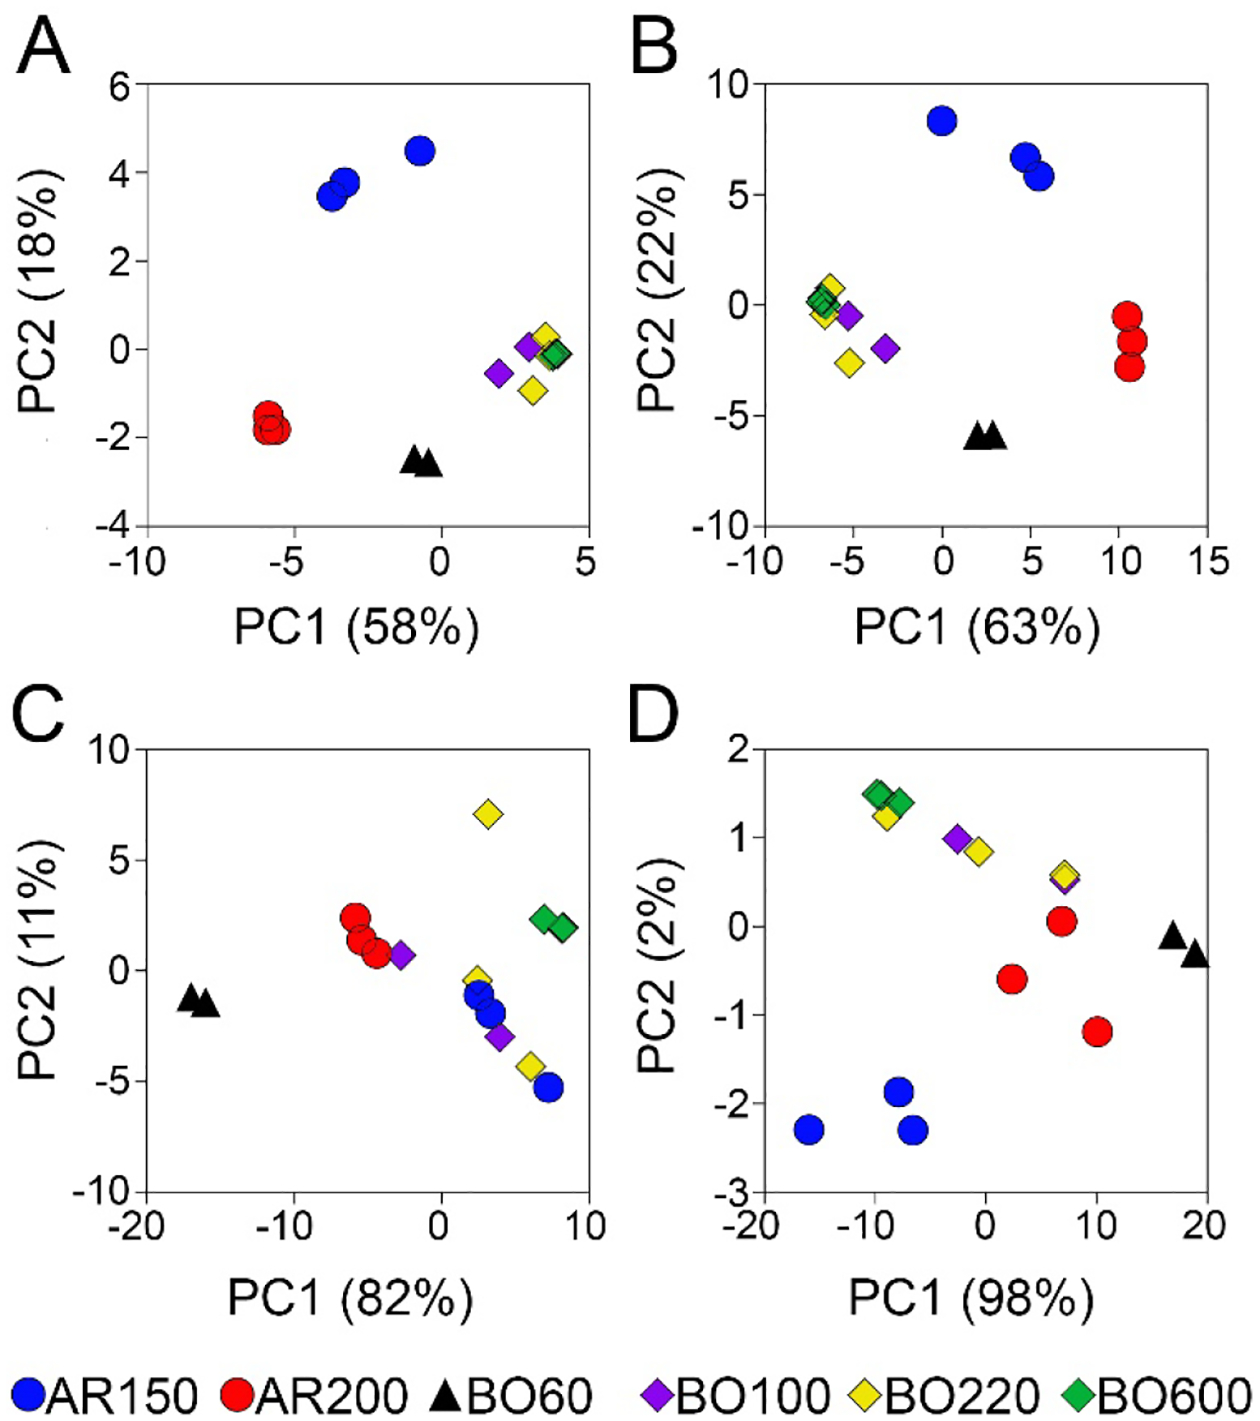
Figure 5. The Principal Component Analysis grouping of petroleum UVCB products.

(A) Grouping based on the relative abundance of all features with assigned molecular formulas (Supplemental Table 5). (B) Grouping based on the carbon chain length distribution (Supplemental Table 8). (C) Grouping based on the hydrocarbon class (Supplemental Table 8). (D) Grouping based on the heteroatom profile (Supplemental Table 9). Colors represent individual samples of the same product as indicated in the legend at the bottom of the figure.
