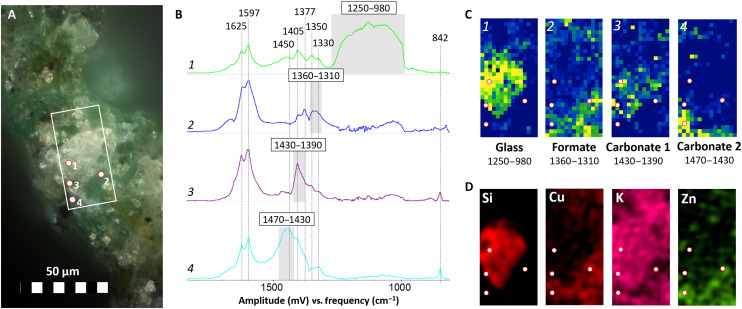
Fig. 1. High-resolution O-PTIR molecular imaging of degradation products on the surface of the degraded brass sequin (1S).
(A) OM photomicrograph of the area in analysis, in evidence the location of the representative spectra shown in (B) (numbered points) and of the imaged area (white rectangle). (B) Representative spectra of the imaged species and integration range (in gray). (C) Corresponding integration maps (30 × 62 μm with a pixel size of 2 μm) with tentative interpretation (integration range in cm−1). (D) Complementary SEM-EDX elemental imaging of the scanned area.

