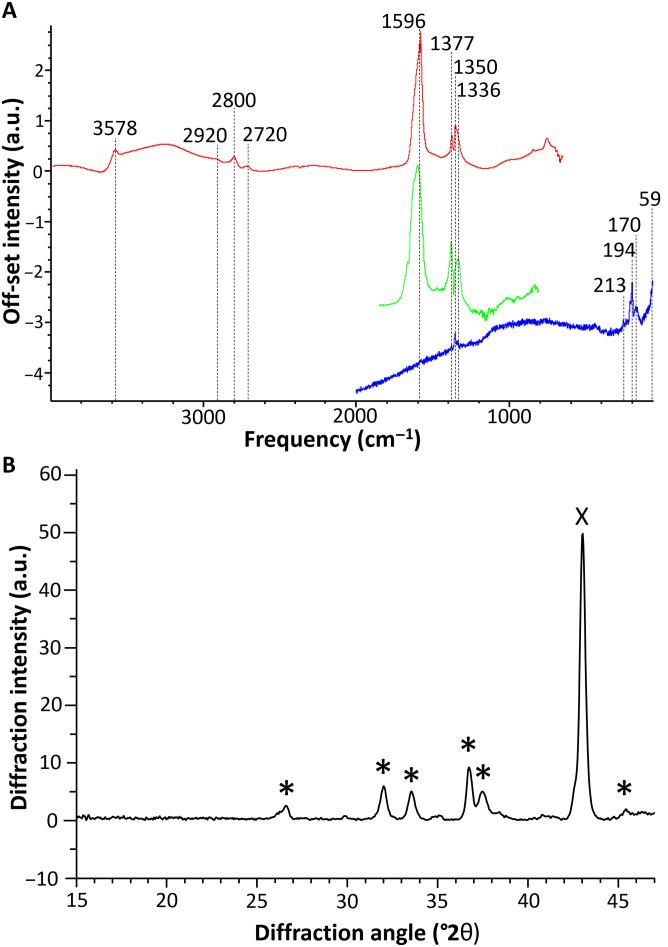
Fig. 4. Experimental spectra of basic Cu formate.
(A) O-PTIR (green), SR-μFTIR (red), and μRaman (blue) on a corroded wire (sample 3W). a.u., arbitrary units. (B) XRPD collected on the corroded sequin (sample 1S), average diffractogram for a 3-mm-long line in the degraded area of the sample. In evidence the diffraction peaks associated to Cu2(OH)3(HCOO) (*) (9) and high-Cu brass (X) (52).

