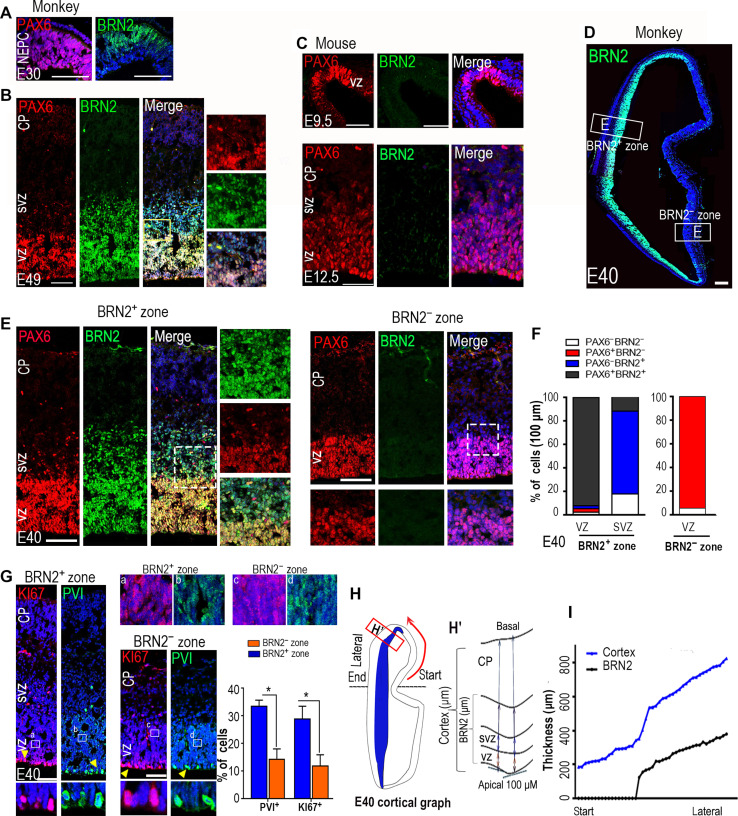
Fig. 1. The spatiotemporal distribution of BRN2 coordinates with RGC expansion in the developing cynomolgus monkey cortex.
(A and B) Dynamic expressions of PAX6 and BRN2 during the monkey cortical expansion through brain coronal sections of the primary visual cortex. BRN2 was initially expressed in NEPCs at embryonic day 30 (E30) (A) and gradually extended along the VZ spread to SVZ at E49 (B). Cortical layers were identified by staining of 4′,6-diamidino-2-phenylindole (DAPI) and PAX6. (C) Immunohistochemical analyses for Brn2 and Pax6 were performed in E9.5 (top) and E12.5 (bottom) mouse neocortices. (D) Images showing the expression patterns of BRN2 in E40 monkey coronal brain sections of the primary visual cortex. (E) Double staining of BRN2 and PAX6 in the E40 VZ and SVZ of BRN2-expressing (BRN2+) or BRN2-absent (BRN2−) zones, respectively. An obvious SVZ was formed in the BRN2+ zone but not in the BRN2− zone. (F) Quantification of BRN2 and PAX6 expression in the BRN2+ and BRN2− zones, respectively. Data are presented as means ± SEM (n = 3 slices); >300 cells per group were counted. (G) Expressions of p-VIMENTIN (PVI) and KI67 in the E40 VZ and SVZ of BRN2+ or BRN2− zones, respectively. The quantification data were only from the cells in the apical regions where cell division occurs. Data are presented as means ± SEM, n = 3 slices; >400 cells per group were counted. Arrowheads indicate positive cells. (a to d) Areas in rectangles are shown with higher magnification. (H) The left panel is a cortical graph at E40, and the right panel is the schematic diagram for measuring the thicknesses of whole-cortex and BRN2-expressing cells in monkey fetal brain. (I) Coordinating BRN2 distribution with the thicknesses of the cortex in E40 monkey neocortex, relative to (H). Start and lateral sites in (H) correspond to those in (I). Blue, DAPI, nuclear staining. Scale bars, 100 μm.

