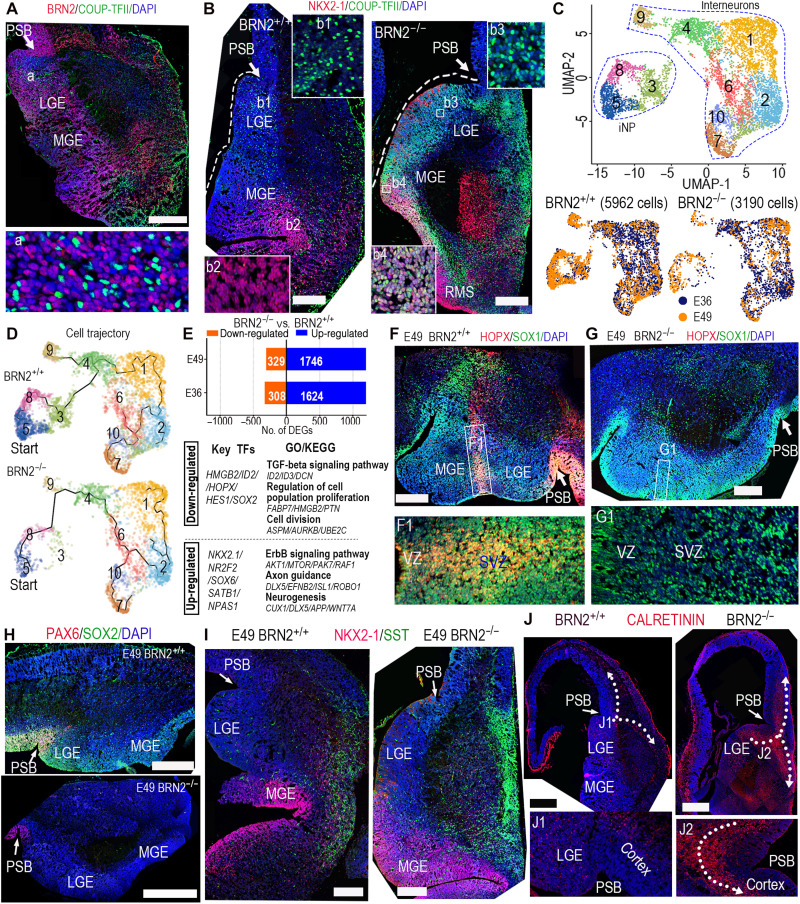
Fig. 4. BRN2 loss produced abnormities of monkey interneuron development.
(A) BRN2 and COUP-TFII staining showed the wide distribution of BRN2 in the telencephalic ganglionic eminences (GEs). PSB, pallial-subpallial boundary. (B) NKX2-1 and COUP-TFII expression in BRN2+/+ and BRN2−/− GEs, showing that COUP-TFII was specifically expressed in BRN2+/+ CGE/LGE, whereas it was obviously activated in the whole BRN2−/− GEs (including both LGE/CGE and MGE). The sections of BRN2+/+ and BRN2−/− were from equivalent coronal levels (details are in Materials and Methods). (C) Visualization of major classes of interneuron and interneuron progenitor (iNP) by UMAP analysis. (D) Developmental trajectory of interneurons and iNPs showing that BRN2 loss changed interneuron development trajectory. Cells in cluster 3 were markedly decreased in BRN2−/− monkeys. (E) DEGs between BRN2+/+ and BRN2−/− interneurons and iNPs (table S4). Representative transcription factors (TFs), GO terms, and KEGG pathways are shown. (F and G) The sections of BRN2+/+ and BRN2−/− telencephalon were from equivalent coronal levels. (F and G) Representative staining images of HOPX and SOX1 in BRN2+/+ (F) and BRN2−/− (G) GEs. F1 and G1 are magnifications of the squares in (F) and (G). (H) PAX6 and SOX2 expression in BRN2+/+ and BRN2−/− GEs. (I) SST and NKX2-1 expression in BRN2+/+ and BRN2−/− GEs, respectively. (J) CALRETININ (CR) expression in BRN2+/+ and BRN2−/− telencephalon. Arrows indicate the migration orientations of CR interneurons. All images of immunofluorescence were from coronal sections spanning the rostral-caudal extent of the telencephalon. Scale bars, 500 μm. Blue, DAPI, nuclear staining.

