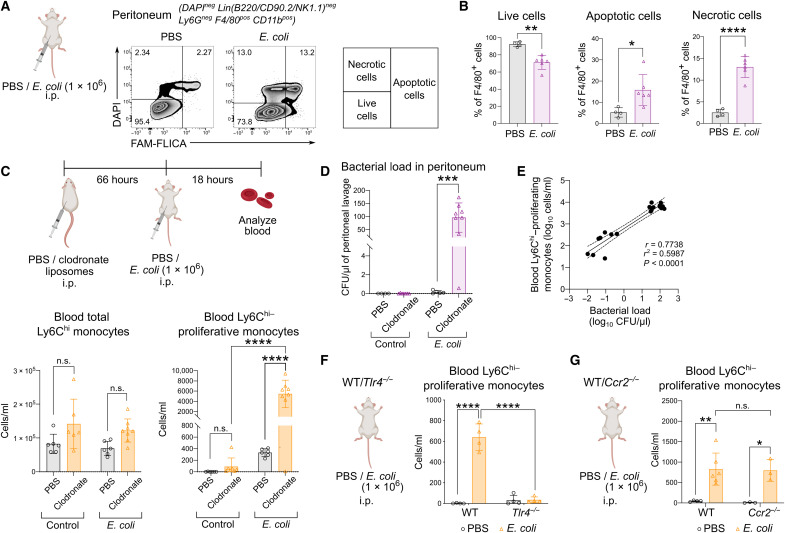
Fig. 2. Emergence of Ly6Chi-proliferative monocytes was CCR2 independent and occurred after bacteria-induced TRM loss.
(A and B) Peritoneal macrophages of mice infected with E. coli or PBS were analyzed for live, apoptotic, and necrotic cells using FAM-FLICA and 4′,6-diamidino-2-phenylindole (DAPI) (A) and their percentage quantified (B) after 18 hours of infection. Numbers in FACS plots represent the percentage of positive cells. Results are expressed as means ± SD (n = 5) and representative of one of two experiments. *P < 0.05, **P < 0.01, and ****P < 0.0001 (Student’s t test). (C to E) Mice were administered clodronate or PBS liposomes intraperitoneally before infection with or without E. coli as indicated. (C) Total Ly6Chi monocytes (bottom left) and proliferative Ly6Chi monocytes (bottom right) in the blood were quantified. Results are expressed as means ± SD (n = 6) and representative of one of three experiments. n.s., not significant; ****P < 0.0001 (one-way ANOVA). (D) Quantification of the peritoneal bacterial load was quantified. Results are expressed as means ± SD (n = 6) and representative of one of three experiments. ***P < 0.001 (Student’s t test). (E) Correlation graph of blood proliferative Ly6Chi monocytes versus bacterial load. (F and G) WT and Tlr4−/− (F) or WT and Ccr2−/− mice (G) were administered E. coli or PBS intraperitoneally, and the blood was analyzed for proliferative Ly6Chi monocytes using BrdU incorporation in vivo after 18 hours. Results are expressed as means ± SD (n = 3 to 6) and representative of one of three experiments. *P < 0.05, **P < 0.01, and ****P < 0.0001 (one-way ANOVA).

